Jie Li, Jihao Zhu, Fengyou Chu, Xiaohu Li, Zhimin Zhu, Hao Wang. Chemical composition and petrogenesis of plagioclases in plagioclase-phyric basalts from the Southwest Indian Ridge (51°E)[J]. Acta Oceanologica Sinica, 2020, 39(7): 42-49. doi: 10.1007/s13131-020-1613-1
Citation:
Jie Li, Jihao Zhu, Fengyou Chu, Xiaohu Li, Zhimin Zhu, Hao Wang. Chemical composition and petrogenesis of plagioclases in plagioclase-phyric basalts from the Southwest Indian Ridge (51°E)[J]. Acta Oceanologica Sinica, 2020, 39(7): 42-49. doi: 10.1007/s13131-020-1613-1
Jie Li, Jihao Zhu, Fengyou Chu, Xiaohu Li, Zhimin Zhu, Hao Wang. Chemical composition and petrogenesis of plagioclases in plagioclase-phyric basalts from the Southwest Indian Ridge (51°E)[J]. Acta Oceanologica Sinica, 2020, 39(7): 42-49. doi: 10.1007/s13131-020-1613-1
Citation:
Jie Li, Jihao Zhu, Fengyou Chu, Xiaohu Li, Zhimin Zhu, Hao Wang. Chemical composition and petrogenesis of plagioclases in plagioclase-phyric basalts from the Southwest Indian Ridge (51°E)[J]. Acta Oceanologica Sinica, 2020, 39(7): 42-49. doi: 10.1007/s13131-020-1613-1
Key Laboratory of Submarine Geosciences, Ministry of Natural Resources, Hangzhou 310012, China
2.
Second Institute of Oceanography, Ministry of Natural Resources, Hangzhou 310012, China
Funds:
The National Natural Science Foundation of China under contract Nos 41606041 and 41903046; the Scientific Research Fund of the Second Institute of Oceanography, MNR under contract Nos JG1604 and JT1504; China Ocean Mineral R&D Association (COMRA) Project under contract Nos DY135-G2-1-03 and DY135-N2-1-04.
Electron microprobe analysis was conducted on plagioclase from the plagioclase ultraphyric basalts (PUBs) erupted on the Southwest Indian Ridge (SWIR) (51°E) to investigate the geochemical changes in order to better understand the magmatic processes occurring under ultraslow spreading ridges and to provide insights into the thermal and dynamic regimes of the magmatic reservoirs and conduit systems. The phenocryst cores are generally calcic (An74–82) and are depleted in FeO and MgO. Whereas the phenocryst rims (An67–71) and the plagioclase in the groundmass (An58–63) are more sodic and have higher FeO and MgO contents than the phenocryst cores. The crystallization temperatures of the phenocryst cores and the calculation of the equilibrium between the phenocrysts and the matrix suggest that the plagioclase cores are unlikely to have crystallized from the host basaltic melt, but are likely to have crystallized from a more calcic melt. The enrichment in incompatible elements (FeO and MgO), as well as the higher FeO/MgO ratios of the outermost phenocryst rims and the groundmass, are the result of plagioclase-melt disequilibrium diffusion during the short residence time in which the plagioclase crystallized. Our results indicate that an evolved melt replenishing under the SWIR (51°E) drives the eruption over a short period of time.
Magmatism at mid-ocean ridges is one of our planet’s most important geological processes as it forms the oceanic crust, which covers nearly two-thirds of the Earth’s surface. Unlike fast spreading ridges, it is widely accepted that ultraslow–spreading ridges have relatively low extents of melting and magmatism, thinner crust, and experience limited crustal processes (Dick, 1989). Although ultraslow–spreading ridges are characterized by low magma supplies, there is also evidence of substantial magmatic processes in magma reservoirs, rather than the stable magma chambers present under some segments (Dick et al., 2003; Coogan et al., 2001; Jian et al., 2017). Until now, how magmas behave in the crust and how the thermal and dynamic regimes of the magma reservoirs and conduit systems effect the eruption mechanism of magmas from ultraslow mid-ocean ridges (MORs) has received comparatively little attention. As the product of erupted magma, mid-ocean ridge basalts (MORBs) can provide information about the magmatism under ridges (Yang et al., 2013). Therefore, unraveling the chemical effects of magmatic processes reflected by the MORBs is key to determining the details of the magma plumbing system beneath ultraslow oceanic spreading centers.
Previous studies have mainly focused on the whole–rock geochemical and isotopic compositions of MORBs from ultraslow–spreading ridges (Dick et al., 2003; Yang et al., 2013, 2017). However, whole–rock geochemistry cannot provide information about the magmatic processes occurring within the crust, which we are attempting to understand, because the bulk–rock compositions of MORBs reflect the variable overprinting of the low–pressure differentiation of mantle–derived primary liquids (Stolper, 1980; Yang et al., 2013). Unlike whole–rock compositions, the major and trace element contents of plagioclase phenocrysts are easily preserved and are sensitive to the physicochemical conditions of the melt from which they crystallized (Ginibre et al., 2004; Mollo et al., 2011; Mutch et al., 2019; Bennett et al., 2019). Their geochemical compositions and morphology are commonly used to obtain information about the conditions of the magmatic system from which they crystallized. For example, Mutch et al. (2019) established an element diffusion model for plagioclase to constrain the timescales of magmatic processes. Bennett et al. (2019) demonstrated that various plagioclase textures in mid–ocean ridge basalts can be used as indicators of various magmatic processes. In addition, the composition of plagioclase can provide information about the conditions of the magmatic system, such as the water content, temperature, and melt composition (Hellevang and Pedersen, 2008; Lange et al., 2013; Coote and Shane, 2016). These conditions are related to magma mixing, fractional crystallization, and assimilation processes. Therefore, plagioclase phenocrysts have the potential to record a magmatic history that might be obscured at the whole–rock geochemical scale. However, compared with continental and other oceanic settings, plagioclase phenocrysts are still underutilized in the study of MORBs from ultraslow spreading ridges.
In recent years, the China Ocean Mineral Resources R&D Association (COMRA) has provided support for scientific expeditions to the Southwest Indian Ridge (SWIR), during which a large number of new samples were collected (Tao et al., 2012). Among the various types of MORBs, plagioclase ultraphyric basalts (PUBs), defined by Cullen et al. (1989), are valuable due to their high plagioclase contents (10%–54%). These plagioclase phenocrysts contain unique information about crustal processes and the characteristics of the magmatic array present in the lower oceanic crust (Hellevang and Pedersen, 2008; Lange et al., 2013; Bennett et al., 2019). In this study, we examined the compositions of plagioclase phenocrysts from PUBs erupted on the SWIR (51°E), which is a typical ultraslow spreading ridge. Microanalysis of these phenocrysts provides an opportunity to investigate the geochemical changes that occurred, and thus, provides insights into the details of the magma reservoirs beneath the ultraslow oceanic spreading centers.
2.
Geologic setting
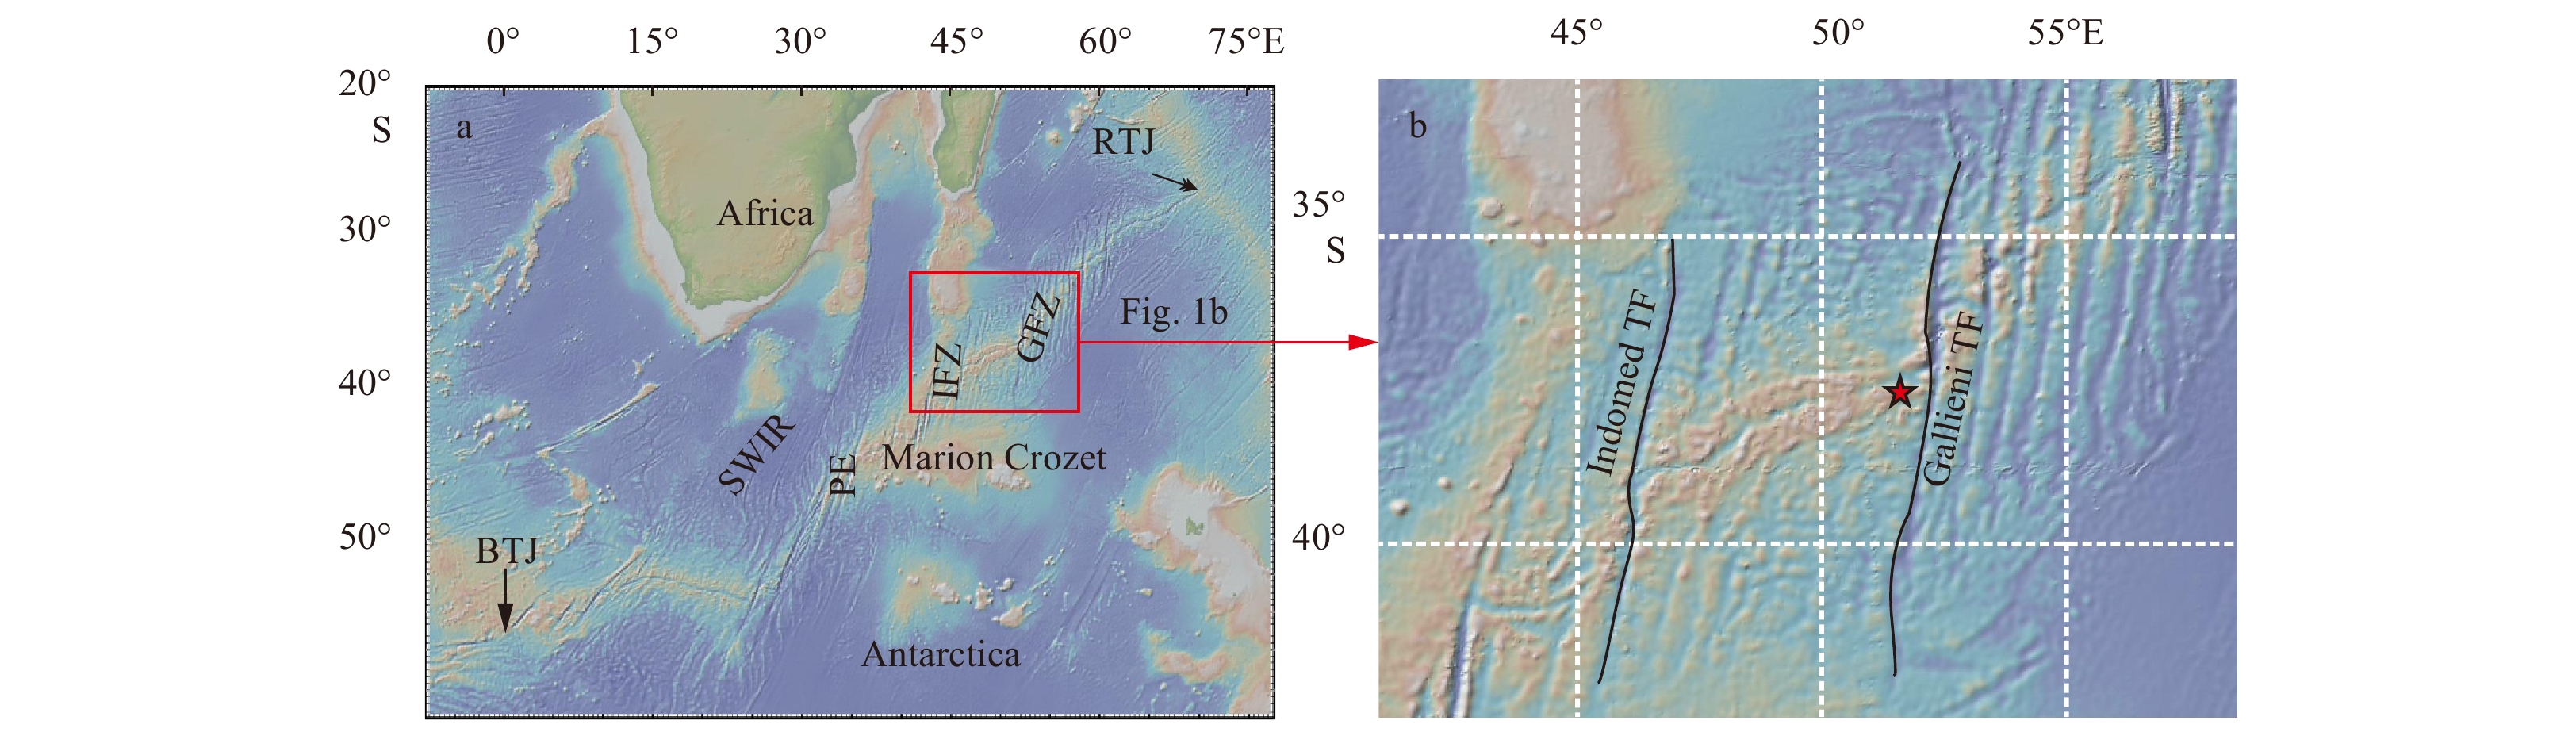
The SWIR is a typical ultraslow spreading ridge, with a half–spreading rate of around 7–9 mm/a (Dick et al., 2003). It separates the African Plate from the Antarctic Plate. The SWIR extends for 8 000 km from the Rodrigues Triple Junction (RTJ, 70°E) at its eastern end to the Bouvet Triple Junction at its western end (BTJ, 0°) (Fig. 1a). The SWIR is characterized by strong segmentation and discontinuous magmatism. Bathymetric data has revealed a shallow central region between the Prince Edward Transform Fracture Zone (35.5°E) and the Gallieni Fracture Zone (52.3°E), with an average depth of ~3 200 m compared with the deeper western (~4 000 m) and the eastern (~4 500 m) sections of the ridge (Cannat et al., 2008). As a result of the Marion hotspot to the southwest, this region has strong negative residual mantle Bouguer gravity anomalies, indicating relatively active crust–mantle exchange, deep magmatism, moderate levels of melting, and a moderate heat supply (Georgen et al., 2001; Sauter et al., 2009).
Figure
1.
Bathymetric map of the Southwest Indian Ridge (SWIR) (a) and location of the sample (b) (http://www.geomapapp.org). The location of the sample used in this study is marked by the star. BTJ: Bouvet Triple Junction; RTJ: Rodrigues Triple Junction; PE: Prince Edward Transform Fracture Zone; IFZ: Indomed Fracture Zone; GFZ: Gallieni Fracture Zone.
The study area and the sample sites are located between the Indomed (46°E) and Gallieni fracture zones (IFZ–GFZ) on the shallow central region of the SWIR (Fig. 1b). Previous geophysical and geochemical studies have been conducted on the ridge segment between the IFZ and GFZ. The center of this segment has anomalously thick crust (up to 10 km) (Niu et al., 2015) compared with that of the neighboring ridge sections. This thick oceanic crust indicates a robust magma supply in this area, which has been inferred to be associate with the Crozet hotspot (Sauter et al., 2009; Zhang et al., 2013) or with tectonic processes (Jian et al., 2017). Segments with robust magma supplies are also promising areas for hydrothermal activity (Tao et al., 2012).
3.
Sample descriptions and analytical methods
The PUB sample examined in this study was collected by television–guided grabs (TVGs) during the R/V Dayang Yihao Cruise DY115–21 to the 51°E magmatic segment in 2010. The sample was collected at a water depth of about 1 655 m. Optical microscopy analysis indicates that lavas from the SWIR are porphyritic and contain ~15% phenocrysts. The phenocrysts are mostly euhedral to subhedral plagioclase with polysynthetic twinning. The other main phase is subhedral to anhedral olivine (<1%). The plagioclase crystals contain abundant melt inclusions. The groundmass is primarily composed of suhedral, lath–like plagioclase and subordinate, anhedral olivine (Fig. 2).
Figure
2.
Photographs and representative photomicrographs (cross–polarized) of the PUB from the SWIR. a. Hand specimens of the sample; b. enhedral to subhedral plagioclase phenocrysts with melt inclusions; and c suhedral. lath–like plagioclase and subordinate, anhedral olive. Pl: plagioclase, Ol: olivine, MI: melt–melt inclusion.
Backscattered electron (BSE) imaging of the plagioclase in polished thin sections was used to characterize the textures of the crystals. Mineral analysis of the plagioclase was conducted using the JEOL JXA 8100 electron microprobe at the Key Laboratory of Submarine Geosciences (KLSG), Ministry of Natural Resources (MNR). The analytical conditions were as follows: a 15 kV accelerating voltage, a 20 nA specimen current, and a 1 μm focused beam. The peak counting times were 90 s for Fe and Mg, and 20 s for all of the other major elements. The detection limits for most of the elements, except for Ti, were lower than 400×10–6, depending on the abundance of the elements. The detection limit of Ti was 600×10–6 due to its lower content. The following natural and synthetic standards were used for the specified elements: Olivine (Si, Mg), Apatite (Ca, P), Hematite (Fe), Albite (Na, Al), Orthoclase (K), Rhodonite (Mn), Rutile (Ti), and Tugtupite (Cl). The raw data was corrected using the ZAF correction. The chemical formulas of the plagioclase phenocrysts were calculated from the mineral analysis results based on 24 anions.
4.
Results
4.1
Texture of the plagioclases
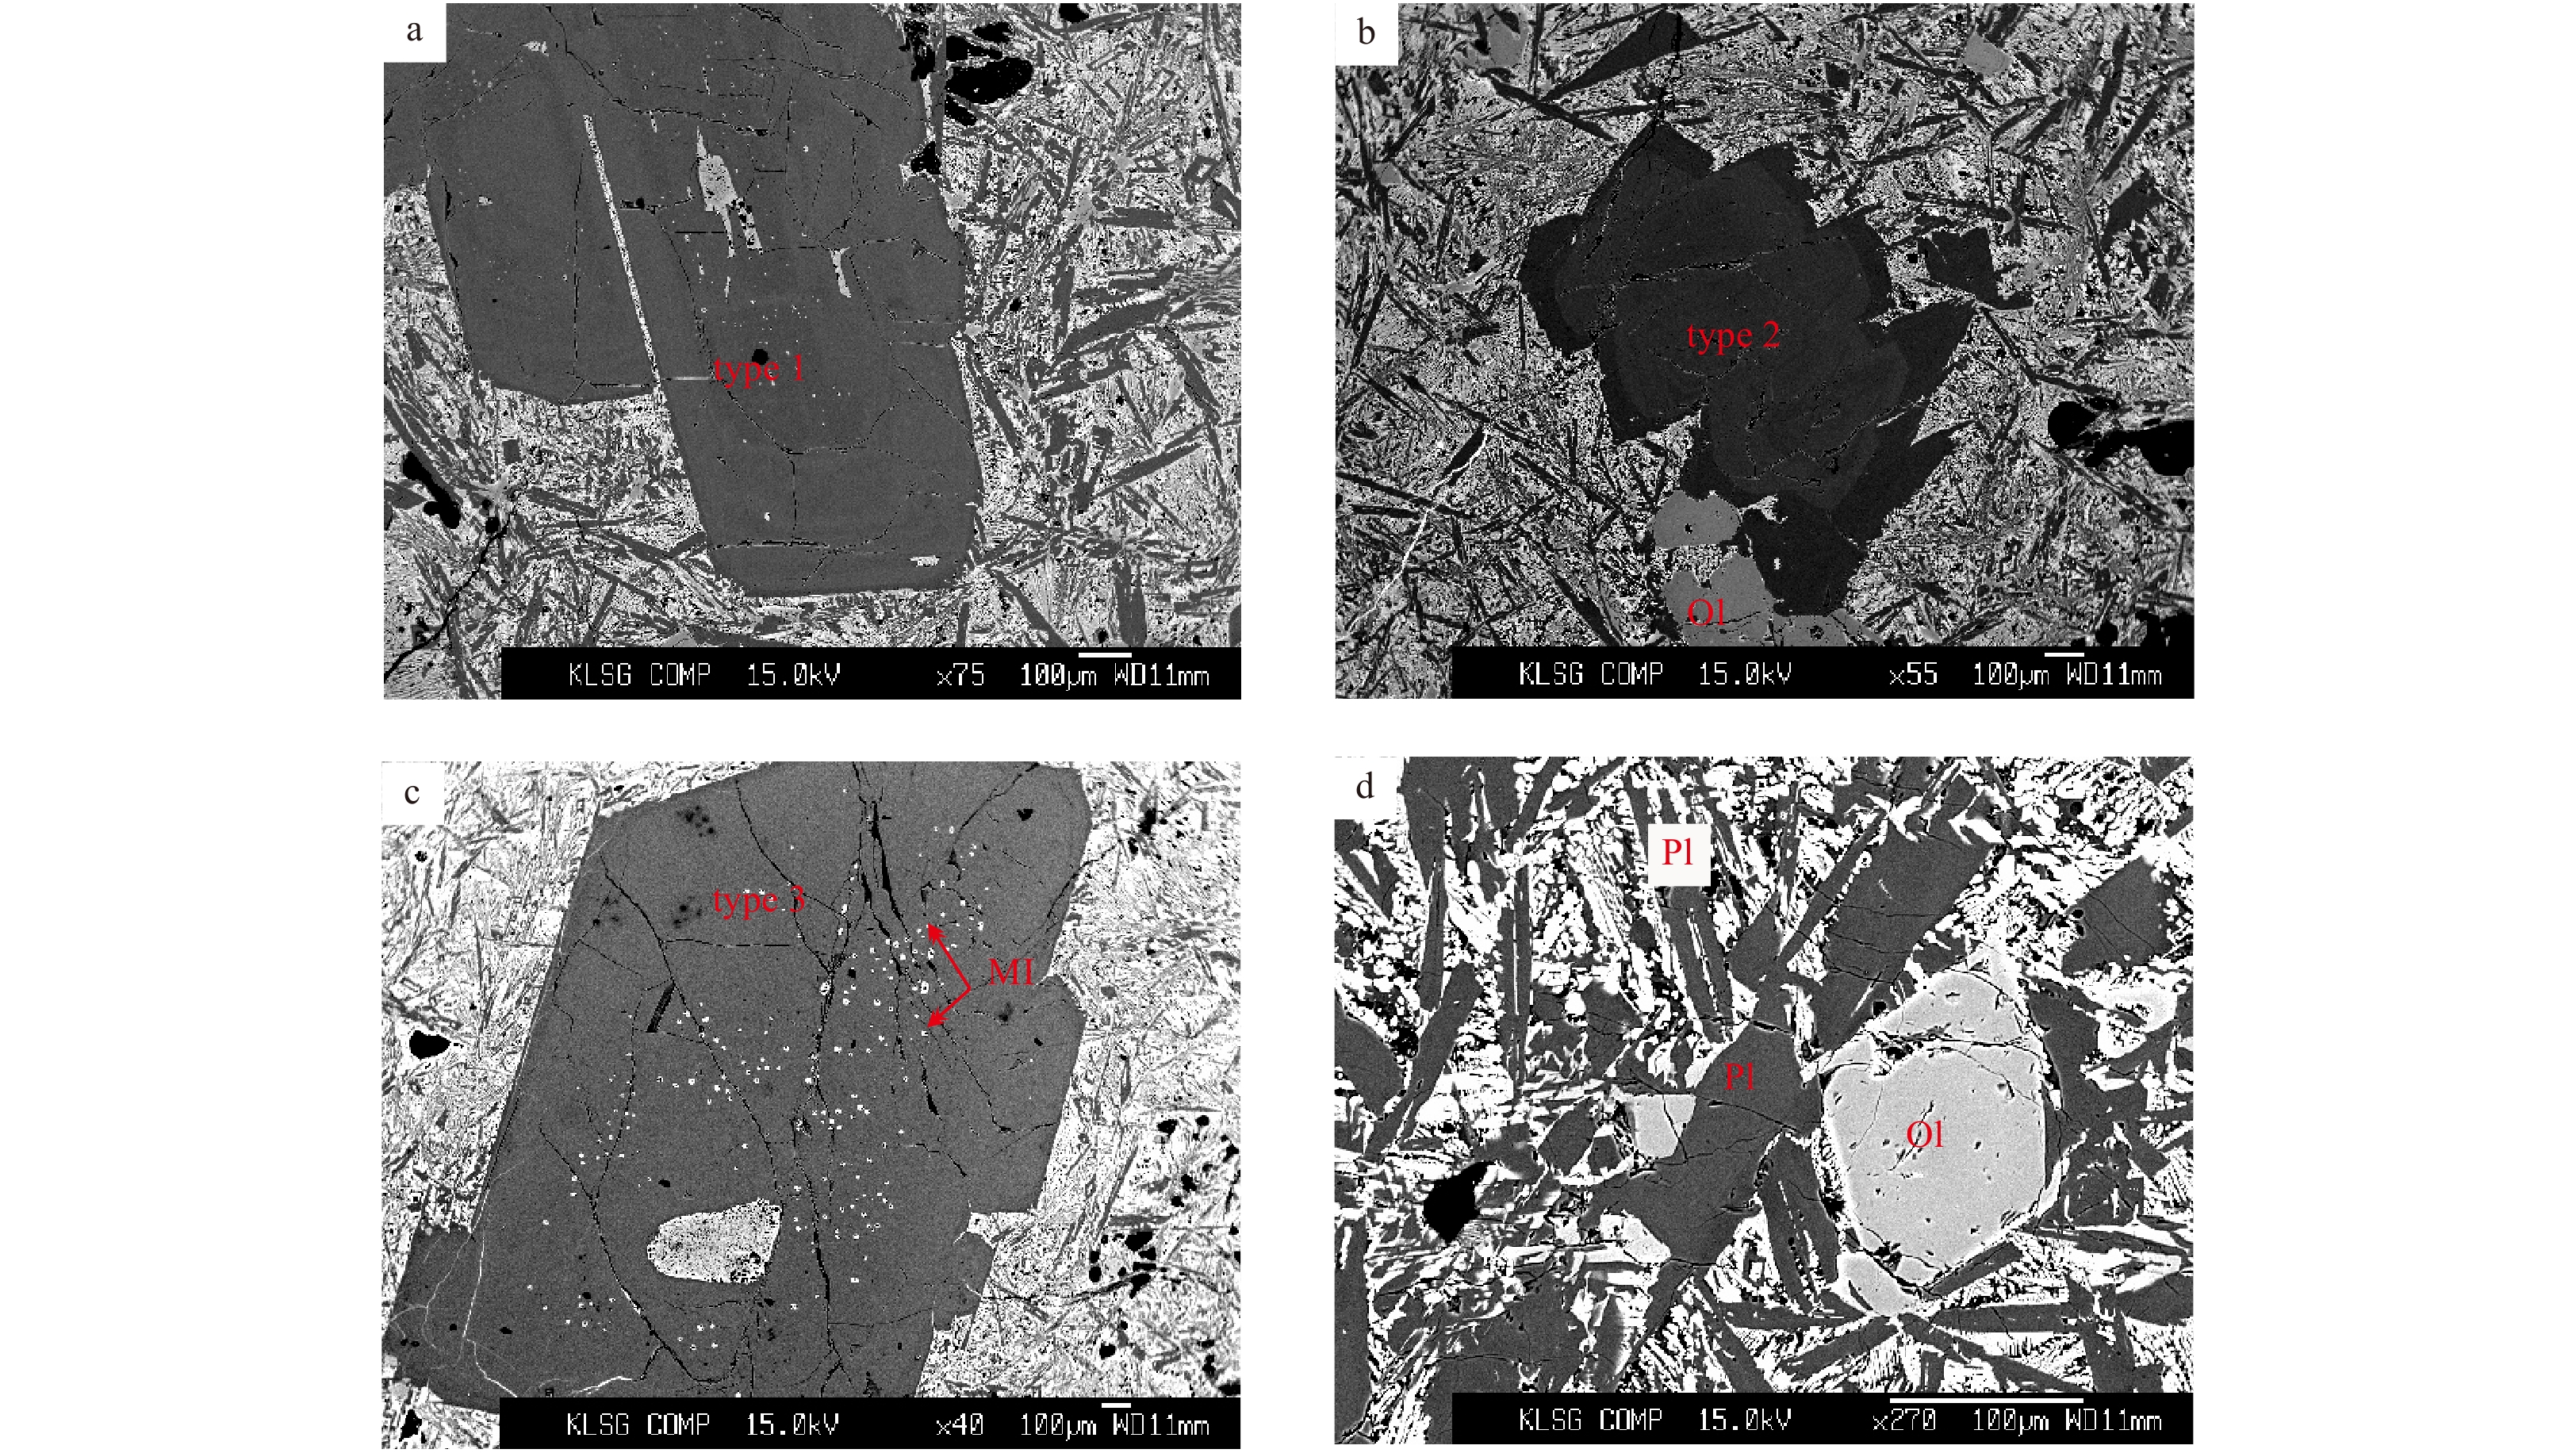
The plagioclase phenocrysts (typically >0.5 mm) from the SWIR are predominantly euhedral to subhedral in shape with tabular habits. They exhibit three textural types (Figs 3a–c). Type 1 plagioclase crystals are characterized by oscillatory zoning, surrounded by a thin rim (<50 μm). Type 2 plagioclase crystals are also characterized by oscillatory zoning, but have wider rims (50–150 μm) than Type 1 plagioclase (<50 μm). Type 3 plagioclase crystals contain numerous circular melt inclusions and do not exhibit oscillatory zoning. The plagioclase in the groundmass varies in size. The relatively large microphenocrysts typically have sizes of 0.01–0.50 mm and are primarily unzoned, whereas the relatively small groundmass microlites are <0.01 mm (Fig. 3d).
Figure
3.
Back-scattered-electron (BSE) images of the different types of plagioclase in the PUB. a. Type 1 plagioclase phenocryst; b. Type 2 plagioclase phenocryst; c. Type 3 plagioclase phenocryst; and d. plagioclase microphenocrysts. MI: melt inclusion.
A total of 25 microprobe analyses were performed on the studied sample. Representative chemical data for the plagioclases are presented in Table 1. These phenocrysts have An contents of 58 to 82. No distinct compositional differences exist among the three types of plagioclase phenocrysts. All of the phenocrysts have calcic cores (An74–82) and sodic rim growth (~An67–71). The variation from the core to the rim is 10–20 mol% An. The plagioclase crystals found within the microphenocrysts and microlites are sodic (An58–63), similar to the rims of the phenocrysts. On the ternary classification diagram, the plagioclase in the studied sample display a continuous range from bytownite to labradorite, with An decreasing from 82 to 58. The cores of the plagioclase phenocrysts are bytownite, while the rims range from bytownite to labradorite. All of the plagioclase crystals in the groundmass are labradorite with lower An contents (Fig. 4).
Table
1.
Representative microprobe data for the plagioclase from the SWIR of this study
Element
Phenocrystal
Groundmass1)
Type I
Type II
Type III
Pl-m
Pl-g
Core
Rim
Core
Rim
Core
Rim
SiO2
48.25
51.42
50.73
52.24
48.80
51.74
53.70
54.69
TiO2
0.06
0.10
0.05
0.00
0.00
0.11
0.08
0.17
Al2O3
31.49
30.03
30.28
29.61
31.70
29.81
28.41
26.72
FeO
0.29
0.40
0.50
0.54
0.38
0.62
0.58
1.41
MnO
0.04
0.00
0.04
0.00
0.00
0.00
0.00
0.00
MgO
0.15
0.19
0.24
0.18
0.20
0.20
0.18
0.37
CaO
16.80
14.52
14.94
14.01
16.29
14.13
12.77
11.92
Na2O
1.99
3.25
2.92
3.42
2.21
3.22
4.15
4.64
K2O
0.01
0.02
0.01
0.03
0.01
0.02
0.04
0.06
P2O5
0.01
0.03
0.00
0.02
0.01
0.00
0.01
0.05
Total
99.08
99.95
99.71
100.04
99.59
99.86
99.92
100.02
Calculated atoms based on 24 oxygens
Si
6.704
7.031
6.962
7.127
6.736
7.072
7.311
7.457
Ti
0.006
0.010
0.005
0.000
0.000
0.011
0.008
0.017
Al
5.157
4.840
4.899
4.761
5.157
4.803
4.559
4.294
Fe
0.034
0.046
0.057
0.062
0.043
0.071
0.066
0.161
Mn
0.005
0.000
0.004
0.000
0.000
0.000
0.000
0.000
Mg
0.031
0.039
0.049
0.036
0.041
0.041
0.037
0.074
Ca
2.501
2.127
2.198
2.047
2.409
2.070
1.863
1.742
Na
0.536
0.862
0.776
0.905
0.591
0.852
1.096
1.225
K
0.002
0.003
0.002
0.005
0.001
0.003
0.007
0.011
P
0.002
0.003
0.000
0.002
0.001
0.000
0.001
0.005
Total
14.977
14.961
14.953
14.945
14.980
14.924
14.947
14.987
An
0.82
0.71
0.74
0.69
0.80
0.71
0.63
0.58
Ab
0.18
0.29
0.26
0.31
0.20
0.29
0.37
0.41
Or
0.00
0.00
0.00
0.00
0.00
0.00
0.00
0.01
FeO/MgO
1.91
2.12
2.08
3.04
1.90
3.06
3.16
3.87
Ca/Na
4.67
2.47
2.83
2.26
4.07
2.43
1.70
1.42
T/°C2)
1296
1108
1237
1098
1280
1129
1063
1042
Note: 1) Pl-m and Pl-g represent plagioclase microphenocrysts and microlites in groundmass, respectively; 2) crystallization temperature is calculated according to Kudo and Weill (1983).
In terms of the major elements, the FeO and MgO concentrations of the plagioclase do not vary significantly. The FeO and MgO concentrations are 0.29%–1.41% (wt) and 0.15%–0.37% (wt), respectively. The FeO and MgO concentrations of the plagioclase cores are relatively depleted compared with those of the plagioclase rims and groundmass.
5.
Discussion
5.1
Crystallization temperature
Plagioclase compositions are a useful indicator of crystallization temperature (Kudo and Weill, 1970; Mollo et al., 2011). In this study, the plagioclase–melt geothermometry method proposed by Kudo and Weill (1970) was used to estimate the crystallization temperature of the plagioclase. Before applying the geothermometry method, the pressures must be determined. According to Chen et al. (2002), the pressures of the plagioclase rims and cores are approximately 0.5×10⁸ and 1.0×10⁸ Pa, respectively. Similarly, the plagioclase in the groundmass is estimated to have crystallized at shallower depths, within the upper crust or on the seabed. The pressure of the groundmass is also assumed to be 0.5×10⁸ Pa according to Chen et al. (2002). Based on the assumptions stated above, Eqs (1) and (2) were used to calculate the crystallization temperatures of the plagioclase crystals:
where $ \lambda$=(XNaXSi/XCaXAl) is for the groundmass, $ \sigma$=(XAbγAb/XAnγAn) is for the plagioclase, and $ \varphi$=(XCa+XAl–XSi–XNa) is for the groundmass. X represents the mole fraction of the component. Although the groundmass is microcrystalline and lacks glass, Lange et al. (2013) demonstrated that PUB hosted glasses have the same range of compositions as aphyric lavas from the same segment. Therefore, in the calculation process, we use the average whole–rock compositions of the aphyric basalts from the same segment, which were reported by Yang et al. (2014), as an approximate proxy for the groundmass.
According to the plagioclase geothermometer described above, the crystallization temperatures of the phenocryst cores and rims are (1 273±18)°C and (1 099±10)°C, respectively. From the core to the rim of the phenocryst, the crystallization temperature decreases by about 200°C. The crystallization temperatures of the microphenocrysts and microlites in the groundmass range from 1 063°C to 1 087°C (average = 1 072°C), which is similar to the crystallization temperature of the phenocryst rims (Table 1).
In previous studies, the crystallization temperatures of high–An (An≥70%) plagioclase phenocrysts, which were estimated from the entrapment temperature of melt inclusions in samples from ultraslow spreading ridges, were found to range from 1 230°C to 1 260°C (Nielsen et al., 1995; Drignon et al., 2019). Whereas the minimum estimation of the crystallization temperature of low An (An<70%) plagioclase is 1 100°C (Yang et al., 2019). The crystallization temperatures in our study are consistent with these results, which suggests that our calculated results are reasonable and the plagioclases thermometer by Kudo and Weill (1970) can be used to calculate the crystallization temperatures of plagioclase phenocrysts from MORBs beneath ultraslow ridges.
5.2
Plagioclase–melt equilibrium
5.2.1
Major elements
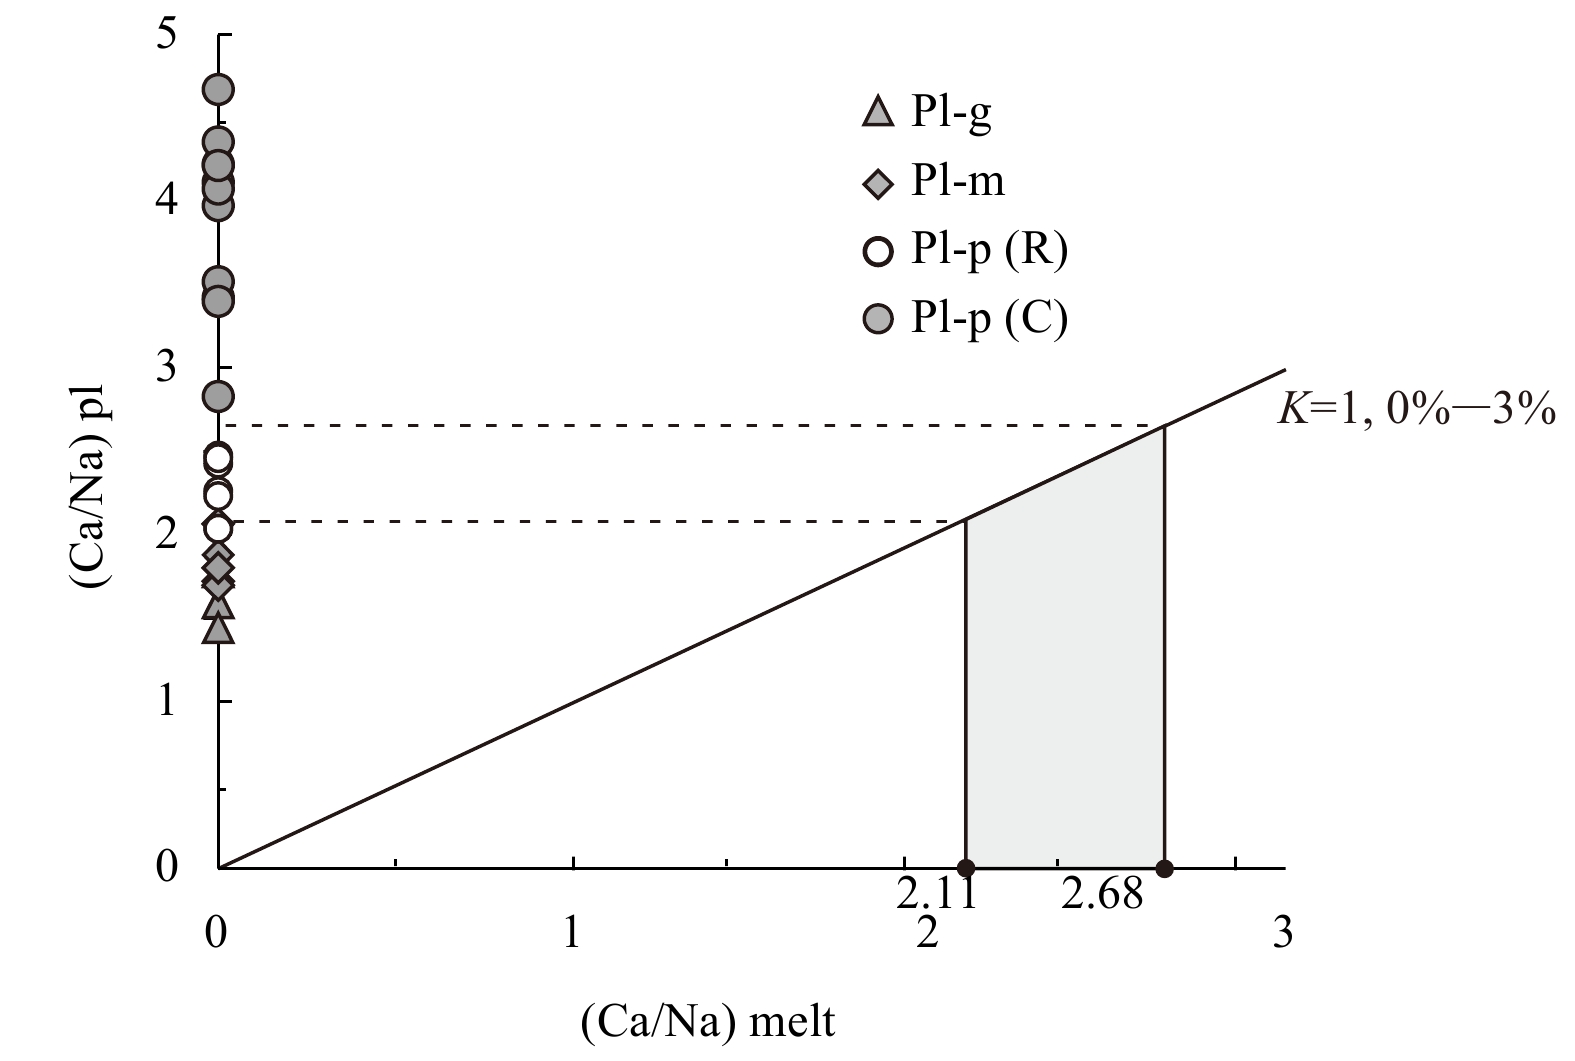
In plagioclase, the diffusion rates of major elements, such as the NaSi–CaAl exchange, are extremely slow (Grove et al., 1984). The geochemical zoning of the crystals likely reflects the magmatic conditions, and thus, it can be used to investigate the likelihood of plagioclase–melt equilibrium. Previous experiments have demonstrated that the partition coefficient of Ca/Na (KCa/Na) between plagioclase and melt mainly positively depends on the water content of the magma (Sisson and Grove, 1993; Martel et al., 2006). For basaltic magmas from mid-ocean ridges, when the magmatic water content is 3%, KCa/Na is typically ~1 for mid to upper lithospheric pressures (<10×108 Pa) (Sisson and Grove, 1993). The magmatic water contents of the SWIR lavas are close to the global average value for the upper mantle (0.3%–0.4%) (Robinson et al., 2001), which indicates that their KCa/Na value is less than 1.
In addition to the KCa/Na value, a representative melt composition is required to assess the equilibrium composition of the plagioclase phenocrysts. The groundmass of these rocks is microcrystalline and lacks glass, so it represents the final melt. Thus, as was discussed above, the average whole–rock composition of the aphyric basalts from the same segment is representative of the groundmass composition. The reported composition of the basalts and glass from this ridge segment do not vary significantly, with molar Ca/Na values ranging from 2.11 to 2.68 (Yang et al., 2014; Bézos and Humler, 2005). The molar Ca/Na values of the plagioclase phenocrysts in equilibrium with the melt are consistently≤2.68 (Fig. 5). The molar Ca/Na values of the plagioclase rims and groundmass range from 1.42 to 2.47, which is in equilibrium with the melt (Fig. 5). However, the compositions of the plagioclase cores (Ca/Na = 3 to 4) are higher than the upper limit of the equilibrium melt (Ca/Na = 2.68) (Fig. 5). In addition, the crystallization temperatures of the plagioclase cores (average of 1 273°C) are close to the experimental melting point of basaltic magma (~1 300°C) and the estimated upper mantle potential temperature of the SWIR lavas (~1 280°C) (Kamenetsky et al., 2000; Robinson et al., 2001). Therefore, the plagioclase cores are unlikely to have formed in the host magma. Instead, they are most likely xenocrysts, which crystallized from a more calcic melt.
Figure
5.
Ca/Na molecular ratio of the plagioclase compared with that of the melt. The melt represents the range of glass and whole-rock compositions, the data are obtained from Yang et al. (2014) and Bézos and Humler (2005). The K values and water contents are from Martel et al. (2006). Equilibrium between the plagioclase and melts is possible in the shaded area.
It is worth noting that compared with the plagioclase rims, the plagioclase phenocrysts in the groundmass have lower Ca/Na ratios (<2). Their more sodic compositions are most likely due to decreasing magmatic water contents caused by the fact that the KCa/Na between the plagioclase and the melt decreases as of the water content of the magma increases (Martel and Schmidt, 2003). Water is lost during the late-stage of magma ascent through the conduit due to ascent–driven decompression of the water-saturated magma. Thus, the compositional variations can be explained by the variations in the magmatic water content.
5.2.2
Mg and Fe contents of the plagioclase
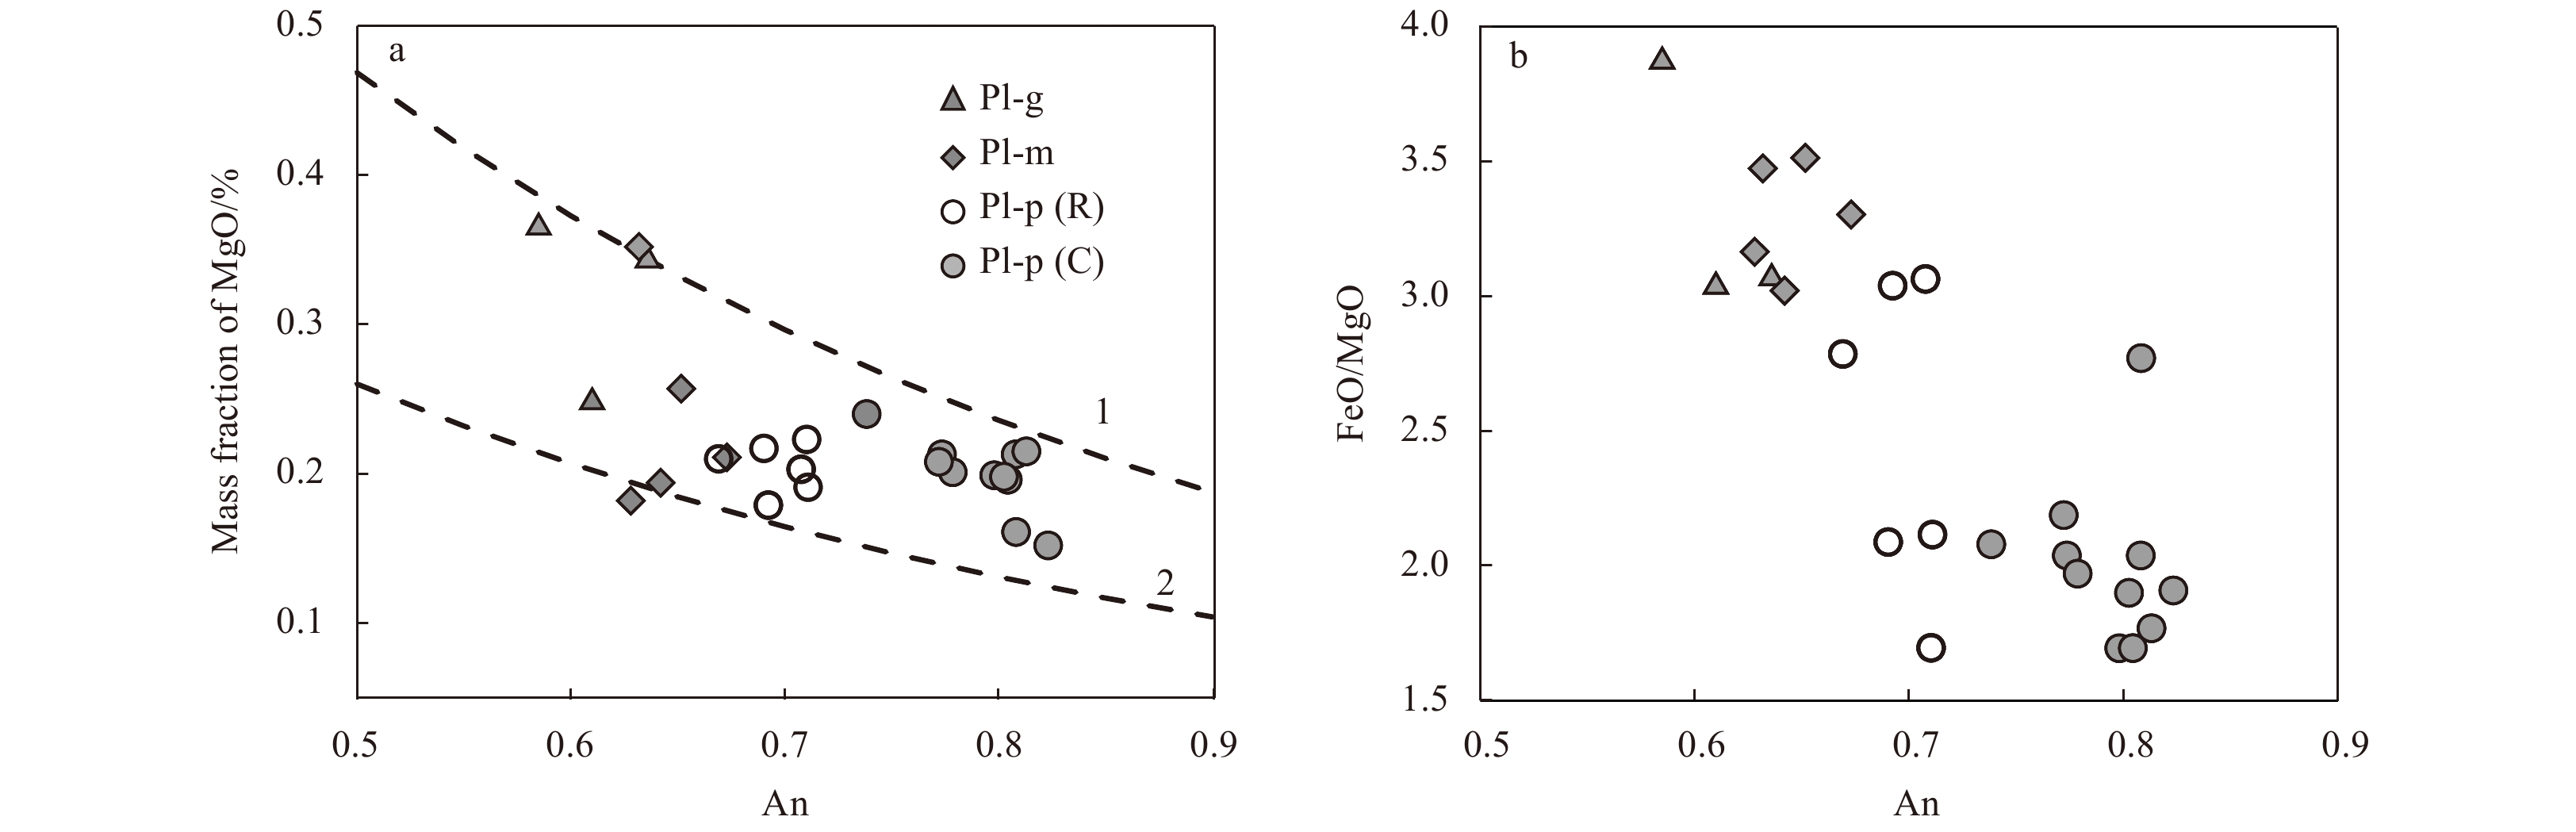
The MgO zoning patterns of the plagioclase phenocrysts have the potential to record the magmatic composition because the Mg contents of the plagioclase phenocrysts reflect the composition of the host melt (Ginibre et al., 2002). Although it is difficult to accurately estimate the Mg partition coefficient (KMg) between plagioclase and melt, empirical studies have suggested an Arrhenius-like relationship of decreasing KMg with increasing XAn (Bindeman et al., 1998). To investigate the equilibrium relationship between the SWIR plagioclase and the host magma, we estimated the KMg based on this empirical relationship, which is often used to determine whether plagioclase phenocrysts are in equilibrium with the melt in magmatic systems (Bindeman et al., 1998; Coote and Shane, 2016). The majority of the plagioclase phenocrysts analyzed in this study are more enriched in MgO than the modeled melt compositions for a crystallization temperature of ~1099°C, which is based on the plagioclase geothermometer described above (Fig. 6a). This implies that the plagioclase in the PUBs analyzed in this study could not have crystallized from the basaltic host melt (MgO of 6.38%–8.87% (wt), average of 7.77% (wt)) and would require a more mafic melt (MgO of up to 14% (wt)). This agrees with the major element modeling (Ca/Na) of the plagioclase cores, but does not agree with the equilibrium between the rims and the melt suggested by the Ca/Na ratios (Fig. 5).
Figure
6.
Compositional plots of An versus MgO (a) and FeO/MgO (b) for the plagioclase. The curves represent plagioclase equilibrium compositions based on the KMg values from Bindeman et al. (1998) and a temperature of 1099℃ obtained from the plagioclase geothermometer. The average crystallization temperature of the phenocryst rims is 1099°C. The following melt parameters were used: (1) MgO=14%, the upper limit of the MgO content of the matrix melt according to a simulation based on the model of Bindeman et al. (1998); (2) MgO=7.77%, the average whole-rock composition of the aphyric basalts in the same segment from the literature, which is representative of the matrix.
The rimward increase in Mg and decrease in An appear to be similar to the trends described in previous diffusion studies (Costa et al., 2003; Moore et al., 2014). When minerals crystallize due to large degrees of undercooling and the diffusion in the melt cannot keep pace with the crystal formation, it is possible for late–stage rapid disequilibrium crystallization to produce a boundary layer melt enriched in incompatible (Fe, Mg) elements (Ginibre et al., 2002; Coote et al., 2018). This could explain the elevated MgO contents of the plagioclase rims and the groundmass plagioclase relative to the equilibrium values (Fig. 6a). The internal disequilibrium in the MgO contents can be explained by the mixing of primitive (MgO=14% (wt)) and more evolved magmas (MgO=7.77%(wt)).
Additionally, in plagioclase, the post–crystallization diffusion of Fe is slower than that of Mg (Costa et al., 2003). Thus, the highest FeO/MgO ratios occur in the outermost parts of the rims and in the groundmass plagioclase (Fig. 6b) due to the fact that FeO diffuses into the plagioclase more slowly than MgO, and thus, more FeO accumulates in the boundary layer during a short residence time. However, it is worth noting that since the FeO content of the plagioclase depends on both the melt composition and the oxygen fugacity, it is difficult to assess the plagioclase–melt equilibrium using only the FeO content (Coote et al., 2018). Therefore, disequilibrium diffusion within a short time period can result in elevated Mg contents compared with the equilibrium values and the highest FeO/MgO ratios occurring in the plagioclase rims (Coote and Shane, 2016; Moore et al., 2014). Whereas the discrepancies in the plagioclase–melt equilibrium inferred from the major elements (Ca/Na) and the Mg contents are likely an artifact of disequilibrium diffusion (Coote and Shane, 2016).
5.3
Implications for the SWIR magma system
In the SWIR, the crystallization temperature and composition of the plagioclase cores are distinctly different from those of the rims (Table 1), which indicates that the plagioclase cores and rims have different thermal histories.
The plagioclase cores are usually uniform and exhibit oscillatory zoning. The oscillatory zoning results in small-scale compositional variations, which suggests a regime of near–constant intensive parameters (pressure, temperature) (Landi et al., 2004; Shcherbakov et al., 2011). These characteristics suggest the cores crystallized from a stable environment and do not have complex crystallization histories. Besides, the presence of cores in plagioclase that are too primitive to be in equilibrium with the host magma indicates that they crystallized from a more primitive region in the plumbing system and were picked up by a more evolved melt later. Thus, we propose that the plagioclase cores grew in a stable mush zone where the temperature was high and constant, and were later entrained into a more evolved melt.
The thin plagioclase rims (normally < 150 μm) have lower crystallization temperatures and lower An values than the cores, and their major elements (Ca/Na) are in equilibrium with the host magma. These characteristics demonstrate that they crystallized from the host melt, which is more evolved than the magma from which the cores crystalized. Similarly, the plagioclase microphenocrysts and microlites are also in equilibrium (Ca/Na) values with the host magma, which suggests that they crystallized from the host magma as well. Compared with fast to intermediate spreading ridges, there are generally no stable magma chambers and the volume of melt may be low under ultraslow mid–ocean ridges (Dick et al., 2003). Thus, the transport of magma into cooler regions of the reservoir would be expected to result in abrupt, strong undercooling of the magma. Due to these large degrees of rapid cooling, the plagioclase phenocrysts in SWIR PUBs generally have thin rims. The plagioclase rims of the phenocrysts exhibit major element (Fe, Mg) enrichment because these elements cannot reach equilibrium when diffusing from the host magma into the plagioclase phenocrysts. The MgO contents of the outermost rims of the plagioclase can be used to calculate the maximum time between the incorporation of the plagioclase into the host melt and quenching on the seafloor (Costa et al., 2003; Moore et al., 2014). We used Eq. (8) in Costa et al. (2003) to determine the Mg diffusion coefficient of the plagioclase. The maximum residence time of the plagioclases in the host melt was nearly 5–8 d. The close temporal relationship between the evolved magma replenishment and the eruption suggests that replenishment plays an important role in driving the eruption, which has also been suggested for other MORB eruptions on slow and intermediate ridges (Costa et al., 2010). Overall, our favored model is that replenishment by an evolved melt under the SWIR ridges (51°E) drives the eruption over a short period of time.
6.
Conclusions
(1) The plagioclase cores with high An values have higher crystallization temperatures (1 273±18)°C than the rims (1 099±10)°C. The range of crystallization temperatures for the microphenocrysts and microlites in the groundmass is similar to that of the phenocryst rims.
(2) The compositions of the plagioclase cores from the SWIR indicate that they did not form in the host magma, but xenocrysts are crystallized from a more mafic melt composition. Whereas the plagioclase rims and the microphenocrysts and microlites in the groundmass are in equilibrium with the host basaltic melts.
(3) The disequilibrium MgO contents and the higher FeO/MgO ratios of the rims of the plagioclase phenocrysts reflect shorter magmatic residence time periods than would be resulting from equilibrium diffusion.
(4) An evolved melt replenished the magma under the SWIR ridges (51°E), driving the eruption over a short period of time.
Acknowledgements
We are grateful to Yin-Jia Jin and two anonymous reviewers for their careful editing and constructive comments, which improved the manuscript. We also thank the crew and scientists involved in the R/V Dayang Yihao Cruise DY115–21.
Bennett E N, Lissenberg C J, Cashman K V. 2019. The significance of plagioclase textures in mid-ocean ridge basalt (Gakkel Ridge, Arctic Ocean). Contributions to Mineralogy and Petrology, 174(6): 49. doi: 10.1007/s00410-019-1587-1
[2]
Bézos A, Humler E. 2005. The Fe3+/ΣFe ratios of MORB glasses and their implications for mantle melting. Geochimica et Cosmochimica Acta, 69(3): 711–725. doi: 10.1016/j.gca.2004.07.026
[3]
Bindeman I N, Davis A M, Drake M J. 1998. Ion microprobe study of plagioclase-basalt partition experiments at natural concentration levels of trace elements. Geochimica et Cosmochimica Acta, 62(7): 1175–1193. doi: 10.1016/S0016-7037(98)00047-7
[4]
Cannat M, Sauter D, Bezos A, et al. 2008. Spreading rate, spreading obliquity, and melt supply at the ultraslow spreading Southwest Indian Ridge. Geochemistry, Geophysics, Geosystems, 9(4): Q04002. doi: 10.1029/2007GC001676
[5]
Chen Xiaoming, Tan Qingquan, Zhao Guangtao. 2002. Plagioclases from the basalt of Okinawa Trough and its petrogenesis significance. Acta Petrologica Sinica (in Chinese), 18(4): 482–488
[6]
Coogan L A, MacLeod C J, Dick H J B, et al. 2001. Whole-rock geochemistry of gabbros from the Southwest Indian Ridge: constraints on geochemical fractionations between the upper and lower oceanic crust and magma chamber processes at (very) slow-spreading ridges. Chemical Geology, 178(1−4): 1–22. doi: 10.1016/S0009-2541(00)00424-1
[7]
Coote A C, Shane P. 2016. Crystal origins and magmatic system beneath Ngauruhoe volcano (New Zealand) revealed by plagioclase textures and compositions. Lithos, 260: 107–119. doi: 10.1016/j.lithos.2016.05.017
[8]
Coote A, Shane P, Stirling C, et al. 2018. The origin of plagioclase phenocrysts in basalts from continental monogenetic volcanoes of the Kaikohe-Bay of Islands field, New Zealand: implications for magmatic assembly and ascent. Contributions to Mineralogy and Petrology, 173(2): 14. doi: 10.1007/s00410-018-1440-y
[9]
Costa F, Chakraborty S, Dohmen R. 2003. Diffusion coupling between trace and major elements and a model for calculation of magma residence times using plagioclase. Geochimica et Cosmochimica Acta, 67(12): 2189–2200. doi: 10.1016/S0016-7037(02)01345-5
[10]
Costa F, Coogan L A, Chakraborty S. 2010. The time scales of magma mixing and mingling involving primitive melts and melt-mush interaction at mid-ocean ridges. Contributions to Mineralogy and Petrology, 159(3): 371–387. doi: 10.1007/s00410-009-0432-3
[11]
Cullen A, Vicenzi E, McBirney A R. 1989. Plagioclase-ultraphyric basalts of the Galapagos Archipelago. Journal of Volcanology and Geothermal Research, 37(3−4): 325–337. doi: 10.1016/0377-0273(89)90087-5
[12]
Dick H J B. 1989. Abyssal peridotites, very slow spreading ridges and ocean ridge magmatism. In: Saunders A D, Norry M J, eds. Magmatism in the Ocean Basins. Geological Society, London, Special Publications, 42: 71–105. doi: 10.1144/GSL.SP.1989.042.01.06
[13]
Dick H J B, Lin Jian, Schouten H. 2003. An ultraslow-spreading class of ocean ridge. Nature, 426(6965): 405–412. doi: 10.1038/nature02128
[14]
Drignon M J, Nielsen R L, Tepley III F J, et al. 2019. Upper mantle origin of plagioclase megacrysts from plagioclase-ultraphyric mid-oceanic ridge basalt. Geology, 47(1): 43–46. doi: 10.1130/G45542.1
[15]
Georgen J E, Lin Jian, Dick H J B. 2001. Evidence from gravity anomalies for interactions of the Marion and Bouvet hotspots with the Southwest Indian Ridge: effects of transform offsets. Earth and Planetary Science Letters, 187(3−4): 283–300. doi: 10.1016/S0012-821X(01)00293-X
[16]
Ginibre C, Wörner G, Kronz A. 2002. Minor-and trace-element zoning in plagioclase: implications for magma chamber processes at Parinacota volcano, northern Chile. Contributions to Mineralogy and Petrology, 143(3): 300–315. doi: 10.1007/s00410-002-0351-z
[17]
Ginibre C, Wörner G, Kronz A. 2004. Structure and dynamics of the laacher see magma chamber (Eifel, Germany) from major and trace element zoning in sanidine: a cathodoluminescence and electron microprobe study. Journal of Petrology, 45(11): 2197–2223. doi: 10.1093/petrology/egh053
[18]
Grove T L, Baker M B, Kinzler R J. 1984. Coupled CaAl-NaSi diffusion in plagioclase feldspar: experiments and applications to cooling rate speedometry. Geochimica et Cosmochimica Acta, 48(10): 2113–2121. doi: 10.1016/0016-7037(84)90391-0
[19]
Hellevang B, Pedersen R B. 2008. Magma ascent and crustal accretion at ultraslow-spreading ridges: constraints from plagioclase ultraphyric basalts from the arctic mid-ocean ridge. Journal of Petrology, 49(2): 267–294
[20]
Jian Hanchao, Singh S C, Chen Y J, et al. 2017. Evidence of an axial magma chamber beneath the ultraslow-spreading Southwest Indian Ridge. Geology, 45(2): 143–146. doi: 10.1130/G38356.1
[21]
Kamenetsky V S, Everard J L, Crawford A J, et al. 2000. Enriched end-member of primitive MORB melts: petrology and geochemistry of glasses from Macquarie Island (SW Pacific). Journal of Petrology, 41(3): 411–430. doi: 10.1093/petrology/41.3.411
[22]
Kudo A M, Weill D F. 1970. An igneous plagioclase thermometer. Contributions to Mineralogy and Petrology, 25(1): 52–65. doi: 10.1007/BF00383062
[23]
Landi P, Métrich N, Bertagnini A, et al. 2004. Dynamics of magma mixing and degassing recorded in plagioclase at Stromboli (Aeolian Archipelago, Italy). Contributions to Mineralogy and Petrology, 147(2): 213–227. doi: 10.1007/s00410-004-0555-5
[24]
Lange A E, Nielsen R L, Tepley III F J, et al. 2013. The petrogenesis of plagioclase-phyric basalts at mid-ocean ridges. Geochemistry, Geophysics, Geosystems, 14(8): 3282–3296. doi: 10.1002/ggge.20207
[25]
Martel C, Radadi Ali A, Poussineau S, et al. 2006. Basalt-inherited microlites in silicic magmas: evidence from Mount Pelée (Martinique, French West Indies). Geology, 34(11): 905–908. doi: 10.1130/G22672A.1
[26]
Martel C, Schmidt B C. 2003. Decompression experiments as an insight into ascent rates of silicic magmas. Contributions to Mineralogy and Petrology, 144(4): 397–415. doi: 10.1007/s00410-002-0404-3
[27]
Mollo S, Putirka K, Iezzi G, et al. 2011. Plagioclase-melt (dis)equilibrium due to cooling dynamics: implications for thermometry, barometry and hygrometry. Lithos, 125(1−2): 221–235. doi: 10.1016/j.lithos.2011.02.008
[28]
Moore A, Coogan L A, Costa F, et al. 2014. Primitive melt replenishment and crystal-mush disaggregation in the weeks preceding the 2005−2006 eruption 9°50′N, EPR. Earth and Planetary Science Letters, 403: 15–26. doi: 10.1016/j.jpgl.2014.06.015
[29]
Mutch E J F, Maclennan J, Holland T J B, et al. 2019. Millennial storage of near--Moho magma. Science, 365(6450): 260–264. doi: 10.1126/science.aax4092
[30]
Nielsen R L, Crum J, Bourgeois R, et al. 1995. Melt inclusions in high-An plagioclase from the Gorda Ridge: an example of the local diversity of MORB parent magmas. Contributions to Mineralogy and Petrology, 122(1−2): 34–50. doi: 10.1007/s004100050111
[31]
Niu Xiongwei, Ruan Aiguo, Li Jiabiao, et al. 2015. Along-axis variation in crustal thickness at the ultraslow spreading Southwest Indian Ridge (50°E) from a wide-angle seismic experiment. Geochemistry, Geophysics, Geosystems, 16(2): 468–485. doi: 10.1002/2014GC005645
[32]
Robinson C J, Bickle M J, Minshull T A, et al. 2001. Low degree melting under the Southwest Indian Ridge: the roles of mantle temperature, conductive cooling and wet melting. Earth and Planetary Science Letters, 188(3−4): 383–398. doi: 10.1016/S0012-821X(01)00329-6
[33]
Sauter D, Cannat M, Meyzen C, et al. 2009. Propagation of a melting anomaly along the ultraslow Southwest Indian Ridge between 46°E and 52°20′E: interaction with the Crozet hotspot?. Geophysical Journal International, 179(2): 687–699. doi: 10.1111/j.1365-246X.2009.04308.x
[34]
Shcherbakov V D, Plechov P Y, Izbekov P E, Shipman J S. 2011. Plagioclase zoning as an indicator of magma processes at Bezymianny Volcano, Kamchatka. Contributions to Mineralogy and Petrology, 162(1): 83–99. doi: 10.1007/s00410-010-0584-1
[35]
Sisson T W, Grove T L. 1993. Experimental investigations of the role of H2O in calc-alkaline differentiation and subduction zone magmatism. Contributions to Mineralogy and Petrology, 113(2): 143–166. doi: 10.1007/BF00283225
[36]
Stolper E. 1980. A phase diagram for mid-ocean ridge basalts: preliminary results and implications for petrogenesis. Contributions to Mineralogy and Petrology, 74(1): 13–27. doi: 10.1007/BF00375485
[37]
Tao Chunhui, Lin Jian, Guo Shiqin, et al. 2012. First active hydrothermal vents on an ultraslow-spreading center: Southwest Indian Ridge. Geology, 40(1): 47–50. doi: 10.1130/G32389.1
[38]
Yang Fan, Huang Xiaolong, Xu Yigang, et al. 2019. Plume-ridge interaction in the South China Sea: thermometric evidence from Hole U1431E of IODP Expedition 349. Lithos, 324−325: 466–478. doi: 10.1016/j.lithos.2018.11.031
[39]
Yang A Y, Zhao Taiping, Zhou Meifu, et al. 2013. Os isotopic compositions of MORBs from the ultra-slow spreading Southwest Indian Ridge: Constraints on the assimilation and fractional crystallization (AFC) processes. Lithos, 179: 28–35. doi: 10.1016/j.lithos.2013.07.020
[40]
Yang A Y, Zhou Meifu, Zhao Taiping, et al. 2014. Chalcophile elemental compositions of morbs from the ultraslow-spreading southwest Indian ridge and controls of lithospheric structure on S-saturated differentiation. Chemical Geology, 382: 1–13. doi: 10.1016/j.chemgeo.2014.05.019
[41]
Yang A Y, Zhao T P, Zhou M F, et al. 2017. Isotopically enriched N-MORB: a new geochemical signature of off-axis plume-ridge interaction-a case study at 50°28′E, Southwest Indian Ridge. Journal of Geophysical Research: Solid Earth, 122(1): 191–213. doi: 10.1002/2016JB013284
[42]
Zhang Tao, Lin Jian, Gao Jinyao. 2013. Magmatism and tectonic processes in Area A hydrothermal vent on the Southwest Indian Ridge. Science China Earth Sciences, 56(12): 2186–2197. doi: 10.1007/s11430-013-4630-5
Table
1.
Representative microprobe data for the plagioclase from the SWIR of this study
Element
Phenocrystal
Groundmass1)
Type I
Type II
Type III
Pl-m
Pl-g
Core
Rim
Core
Rim
Core
Rim
SiO2
48.25
51.42
50.73
52.24
48.80
51.74
53.70
54.69
TiO2
0.06
0.10
0.05
0.00
0.00
0.11
0.08
0.17
Al2O3
31.49
30.03
30.28
29.61
31.70
29.81
28.41
26.72
FeO
0.29
0.40
0.50
0.54
0.38
0.62
0.58
1.41
MnO
0.04
0.00
0.04
0.00
0.00
0.00
0.00
0.00
MgO
0.15
0.19
0.24
0.18
0.20
0.20
0.18
0.37
CaO
16.80
14.52
14.94
14.01
16.29
14.13
12.77
11.92
Na2O
1.99
3.25
2.92
3.42
2.21
3.22
4.15
4.64
K2O
0.01
0.02
0.01
0.03
0.01
0.02
0.04
0.06
P2O5
0.01
0.03
0.00
0.02
0.01
0.00
0.01
0.05
Total
99.08
99.95
99.71
100.04
99.59
99.86
99.92
100.02
Calculated atoms based on 24 oxygens
Si
6.704
7.031
6.962
7.127
6.736
7.072
7.311
7.457
Ti
0.006
0.010
0.005
0.000
0.000
0.011
0.008
0.017
Al
5.157
4.840
4.899
4.761
5.157
4.803
4.559
4.294
Fe
0.034
0.046
0.057
0.062
0.043
0.071
0.066
0.161
Mn
0.005
0.000
0.004
0.000
0.000
0.000
0.000
0.000
Mg
0.031
0.039
0.049
0.036
0.041
0.041
0.037
0.074
Ca
2.501
2.127
2.198
2.047
2.409
2.070
1.863
1.742
Na
0.536
0.862
0.776
0.905
0.591
0.852
1.096
1.225
K
0.002
0.003
0.002
0.005
0.001
0.003
0.007
0.011
P
0.002
0.003
0.000
0.002
0.001
0.000
0.001
0.005
Total
14.977
14.961
14.953
14.945
14.980
14.924
14.947
14.987
An
0.82
0.71
0.74
0.69
0.80
0.71
0.63
0.58
Ab
0.18
0.29
0.26
0.31
0.20
0.29
0.37
0.41
Or
0.00
0.00
0.00
0.00
0.00
0.00
0.00
0.01
FeO/MgO
1.91
2.12
2.08
3.04
1.90
3.06
3.16
3.87
Ca/Na
4.67
2.47
2.83
2.26
4.07
2.43
1.70
1.42
T/°C2)
1296
1108
1237
1098
1280
1129
1063
1042
Note: 1) Pl-m and Pl-g represent plagioclase microphenocrysts and microlites in groundmass, respectively; 2) crystallization temperature is calculated according to Kudo and Weill (1983).
Figure 1. Bathymetric map of the Southwest Indian Ridge (SWIR) (a) and location of the sample (b) (http://www.geomapapp.org). The location of the sample used in this study is marked by the star. BTJ: Bouvet Triple Junction; RTJ: Rodrigues Triple Junction; PE: Prince Edward Transform Fracture Zone; IFZ: Indomed Fracture Zone; GFZ: Gallieni Fracture Zone.
Figure 2. Photographs and representative photomicrographs (cross–polarized) of the PUB from the SWIR. a. Hand specimens of the sample; b. enhedral to subhedral plagioclase phenocrysts with melt inclusions; and c suhedral. lath–like plagioclase and subordinate, anhedral olive. Pl: plagioclase, Ol: olivine, MI: melt–melt inclusion.
Figure 3. Back-scattered-electron (BSE) images of the different types of plagioclase in the PUB. a. Type 1 plagioclase phenocryst; b. Type 2 plagioclase phenocryst; c. Type 3 plagioclase phenocryst; and d. plagioclase microphenocrysts. MI: melt inclusion.
Figure 4. Or–Ab–An classification diagram of plagioclase.
Figure 5. Ca/Na molecular ratio of the plagioclase compared with that of the melt. The melt represents the range of glass and whole-rock compositions, the data are obtained from Yang et al. (2014) and Bézos and Humler (2005). The K values and water contents are from Martel et al. (2006). Equilibrium between the plagioclase and melts is possible in the shaded area.
Figure 6. Compositional plots of An versus MgO (a) and FeO/MgO (b) for the plagioclase. The curves represent plagioclase equilibrium compositions based on the KMg values from Bindeman et al. (1998) and a temperature of 1099℃ obtained from the plagioclase geothermometer. The average crystallization temperature of the phenocryst rims is 1099°C. The following melt parameters were used: (1) MgO=14%, the upper limit of the MgO content of the matrix melt according to a simulation based on the model of Bindeman et al. (1998); (2) MgO=7.77%, the average whole-rock composition of the aphyric basalts in the same segment from the literature, which is representative of the matrix.


 DownLoad:


 DownLoad: