

Unveiling controls of the latitudinal gradient of surface pCO2 in the Kuroshio Extension and its recirculation regions (northwestern North Pacific) in late spring
-
Abstract: In the northwestern North Pacific, annual net air-sea CO2 flux is greatest in the Kuroshio Extension (KE) zone, owing to its low annual mean partial pressure of CO2 (pCO2), and it decreases southward across the basin. To quantify the influences of factors controlling the latitudinal gradient in CO2 uptake, sea surface pCO2 and related parameters were investigated in late spring of 2018 in a study spanning the KE, Kuroshio Recirculation (KR), and subtropical zones. We found that the sea-to-air pCO2 difference (ΔpCO2) was negative and at its lowest in the KE zone. ΔpCO2 gradually increased southward across the KR zone, and the sea surface was nearly in air-equilibrium with atmospheric CO2 in the subtropical zone. We found that northward cooling and vertical mixing were the two major processes governing the latitudinal gradient in surface pCO2 and ΔpCO2, while biological influences were relatively minor. In the KE zone affected by upwelling, the vertical-mixing-induced increase in surface pCO2 likely canceled out approximately 61% of the decrease in surface pCO2 caused by cooling and biological activities. Moreover, the prolonged air-sea equilibration for CO2 and relatively short hydraulic retention time jointly led to the low surface pCO2 in the KE zone in spring. Ultimately, the cooling KE current flows out of the region before it can be re-equilibrated with atmospheric CO2.
-
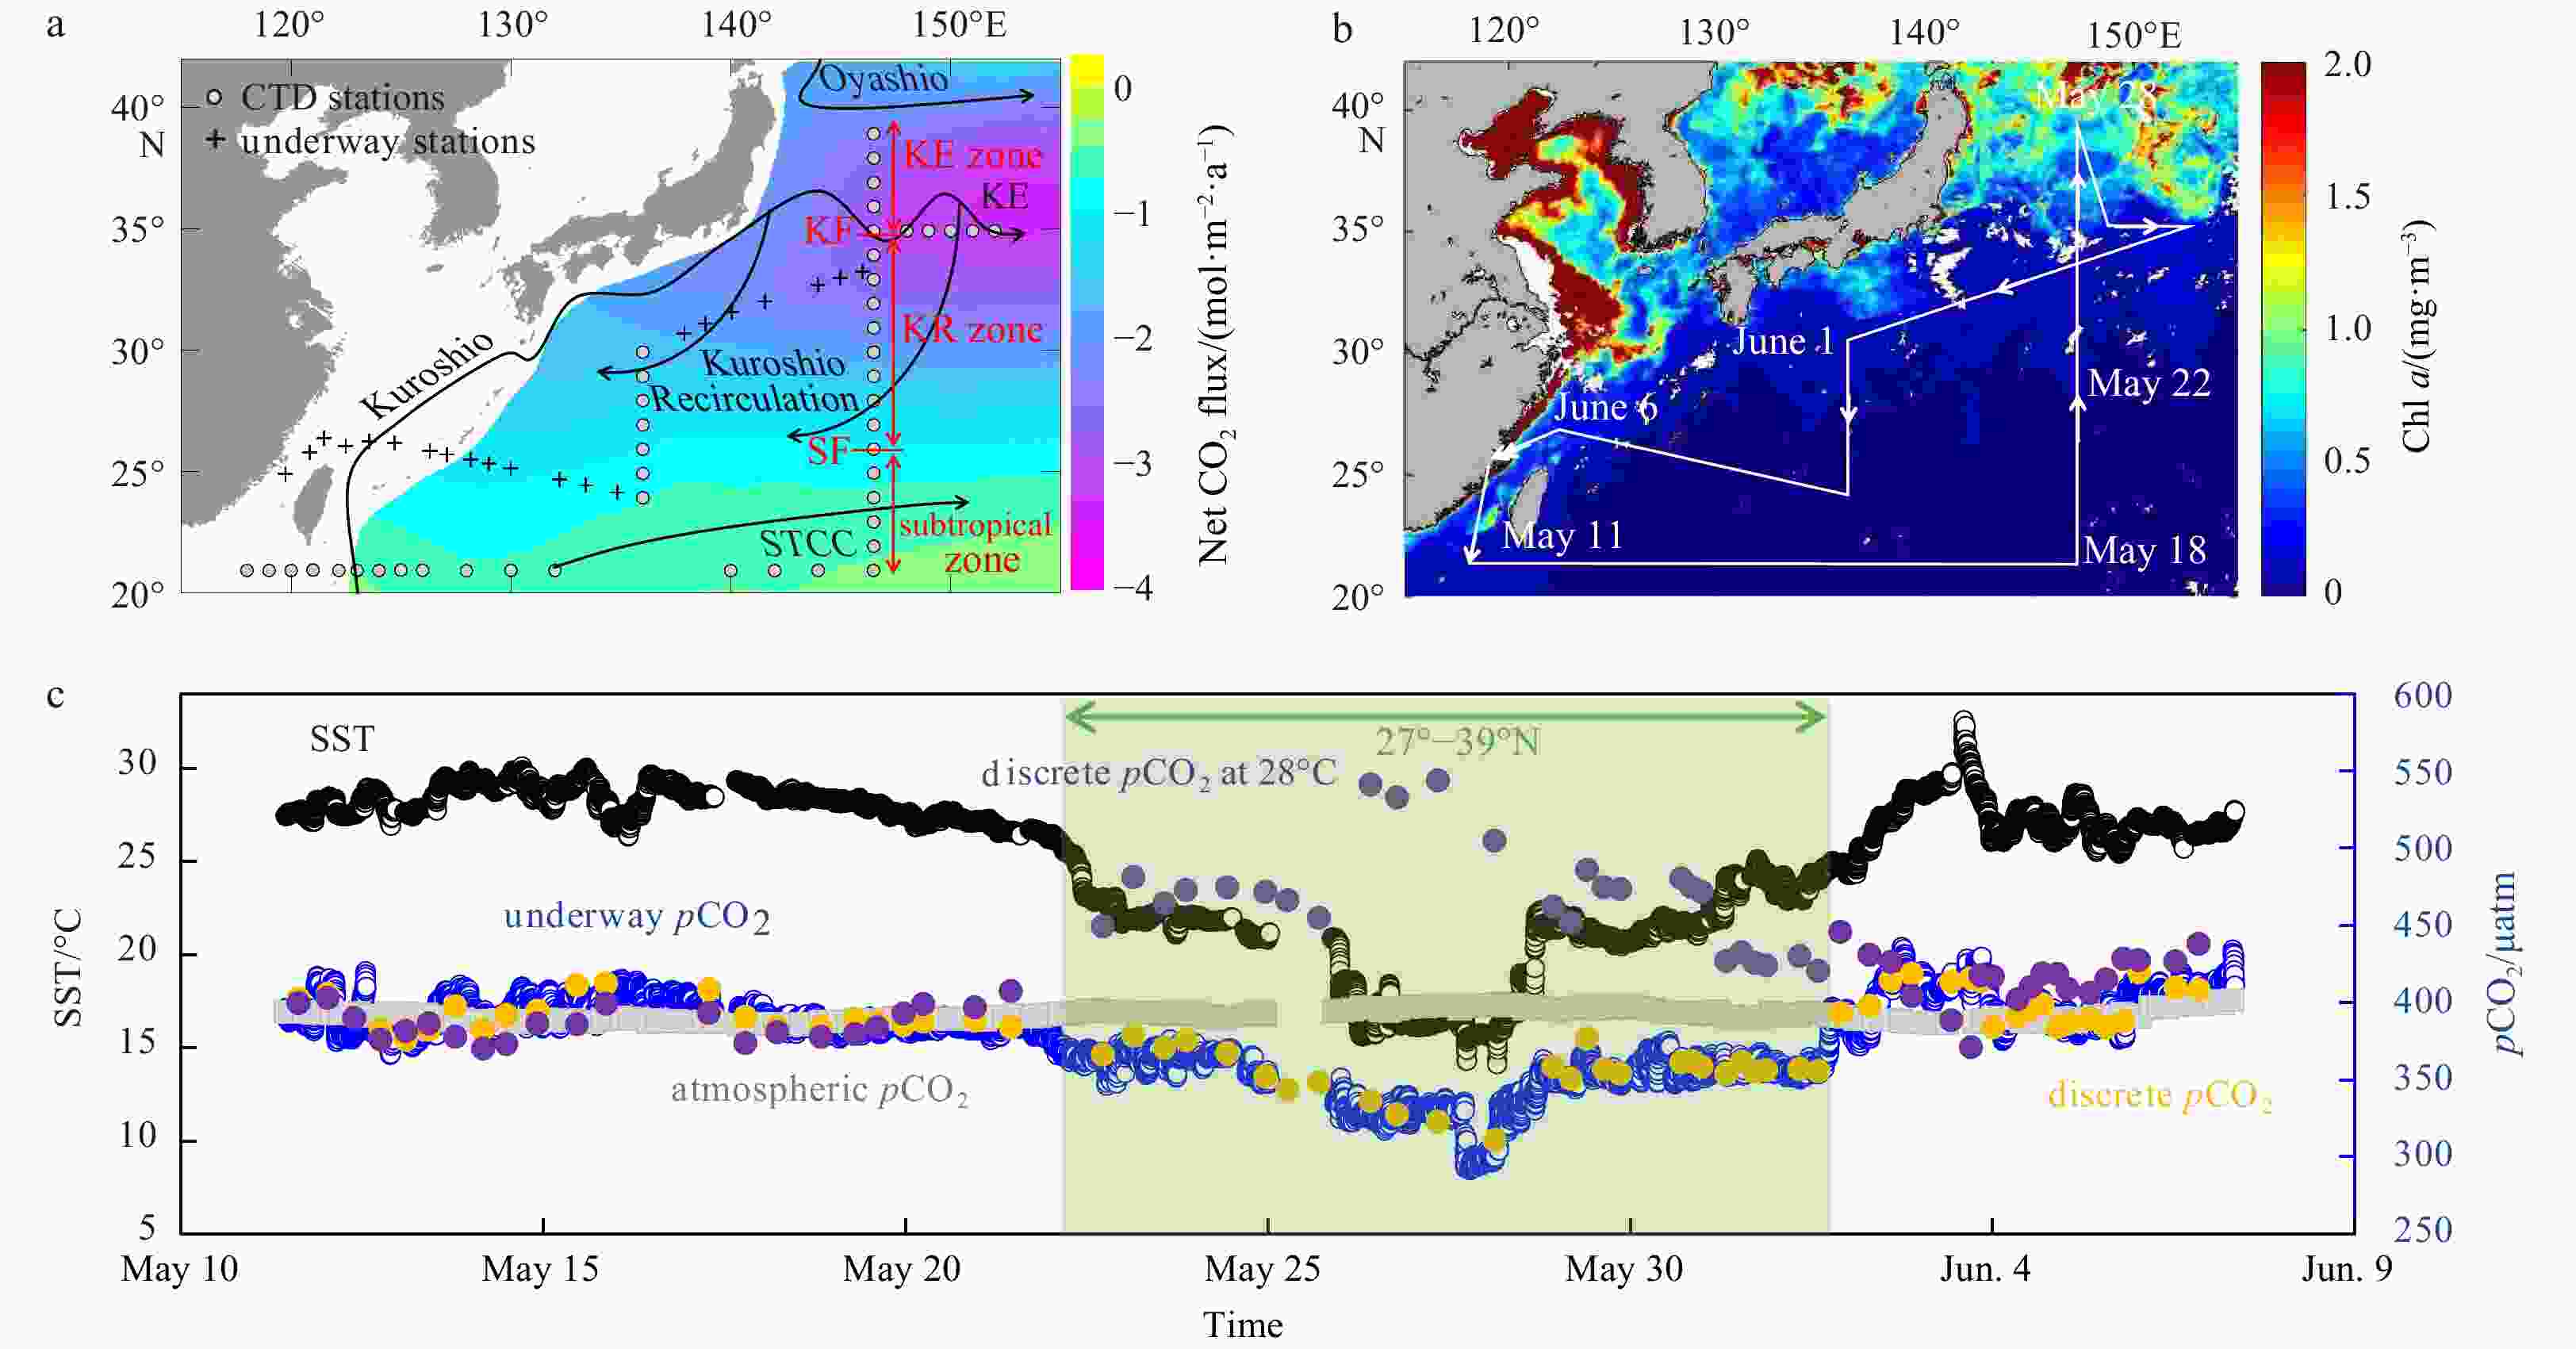
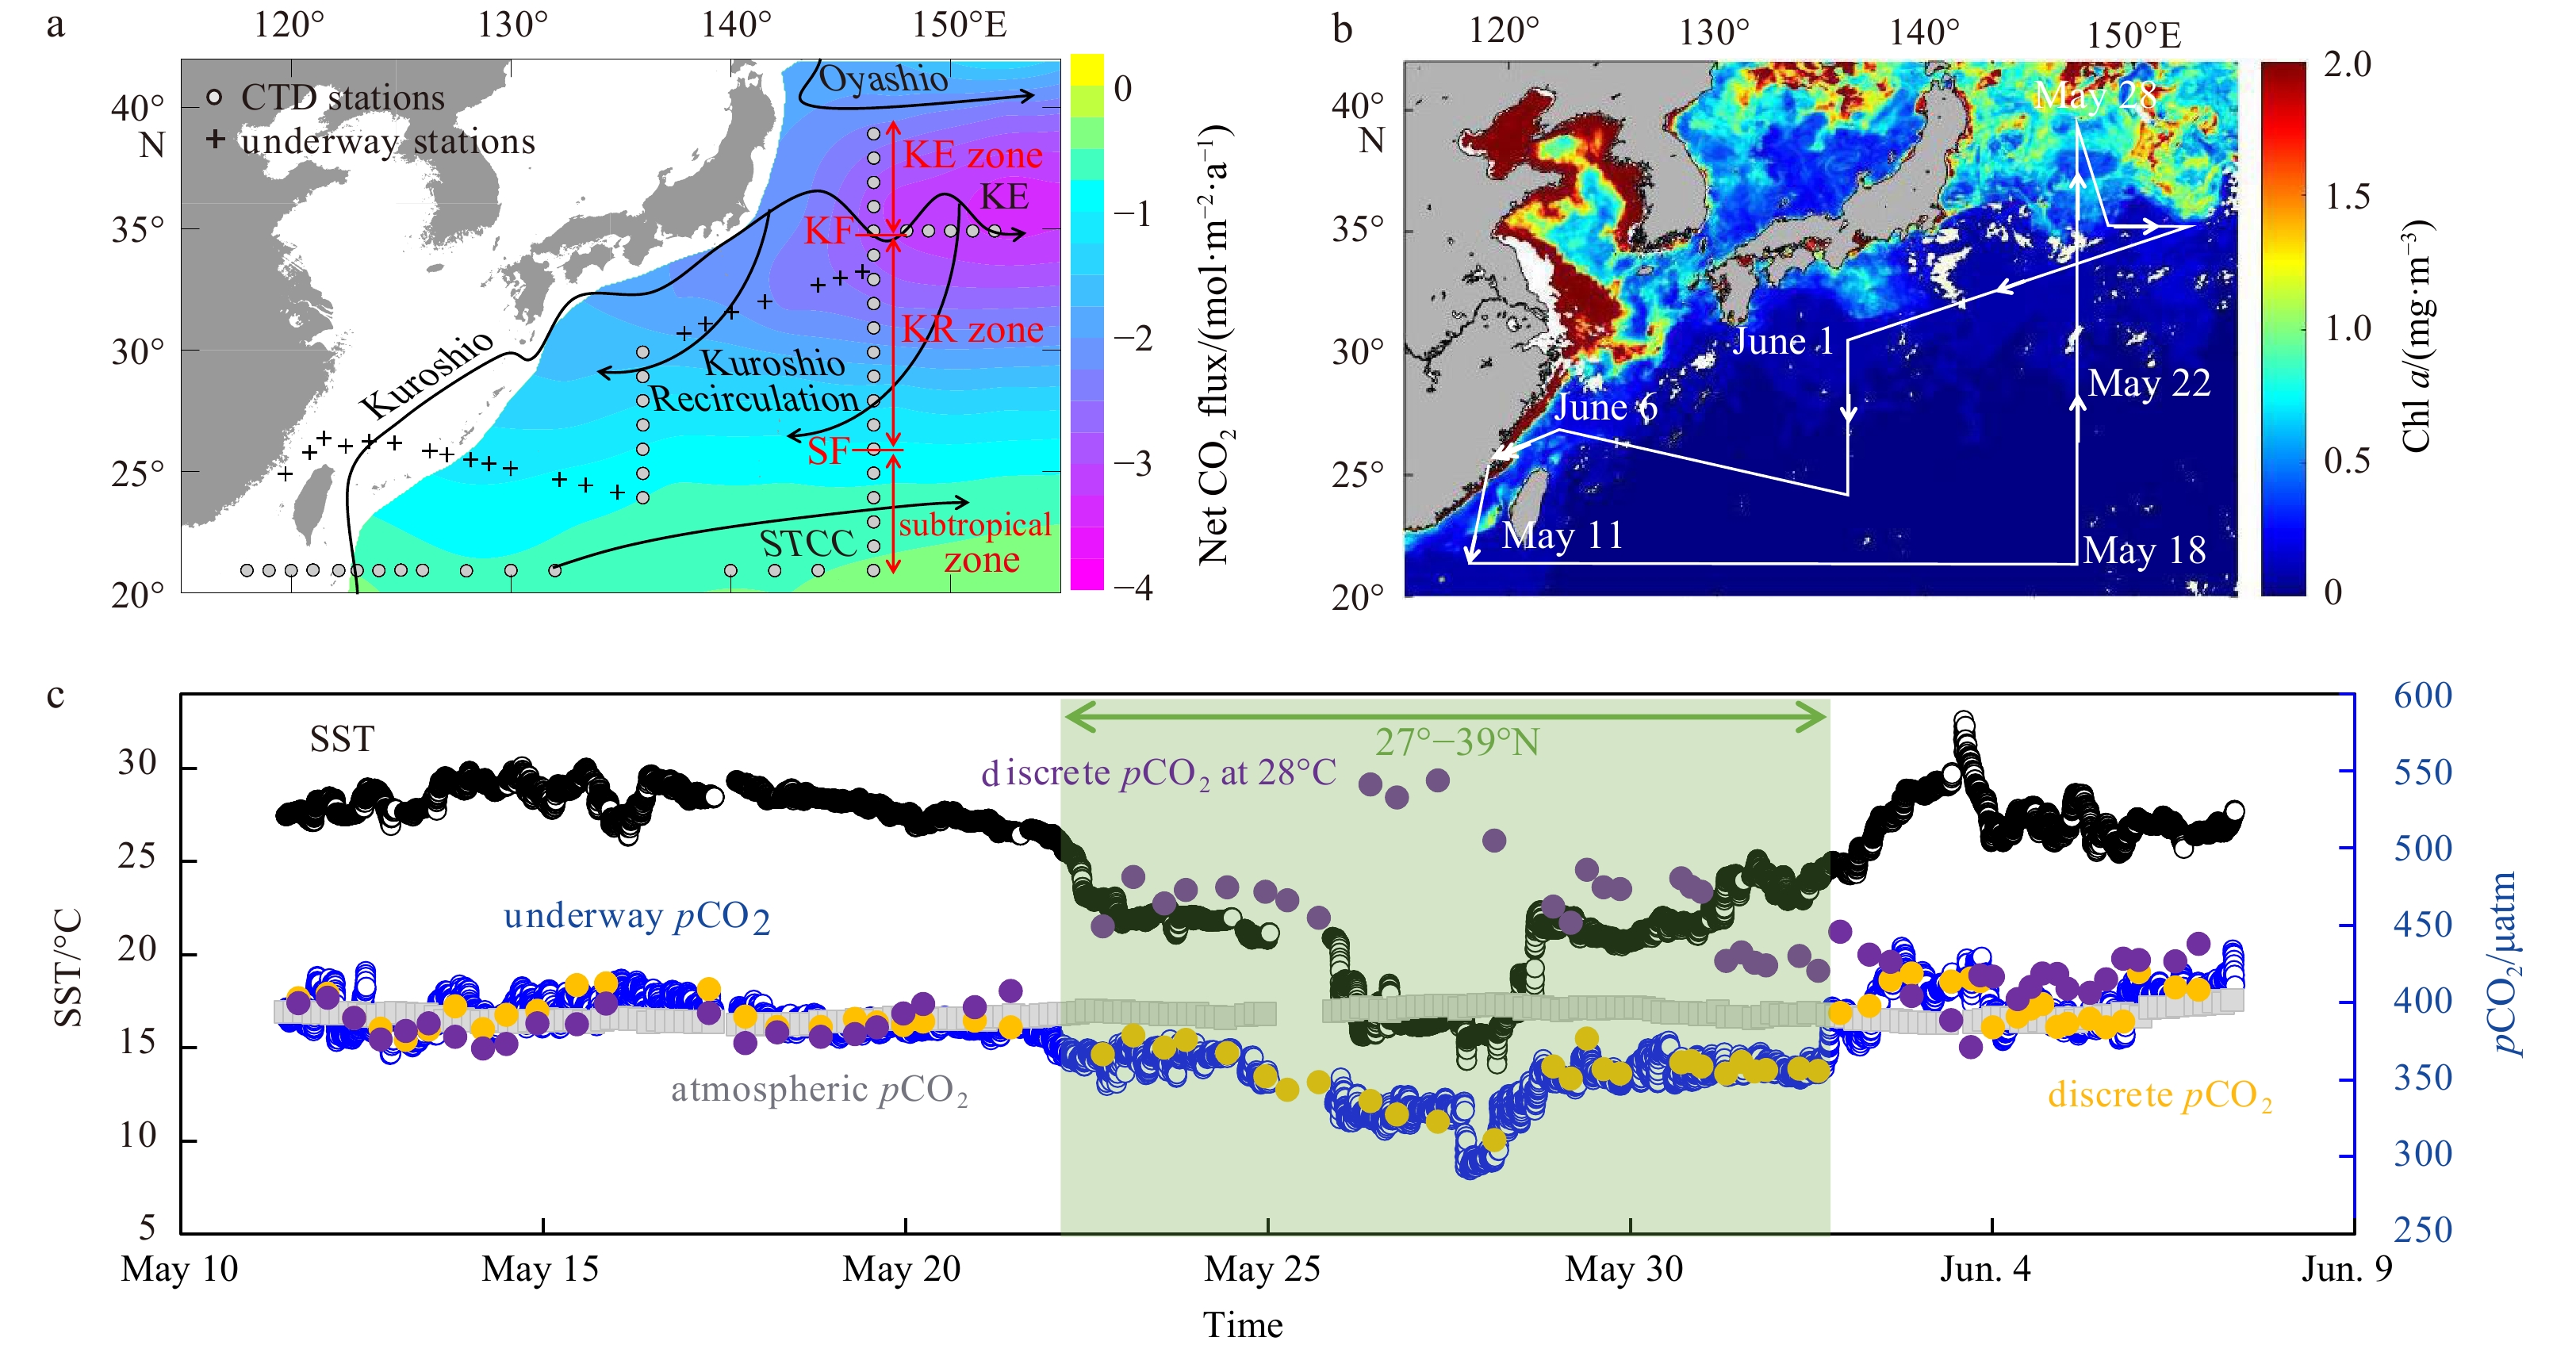
Figure 1. Study area and surface data. a. Northwestern North Pacific and sampling sites in May 2018. Circles and pluses in a represent conductivity-temperature-depth/pressure and underway sampling stations, respectively. The climatological mean annual net air-sea CO2 flux was replotted from Takahashi et al. (2009). Negative values indicate oceanic CO2 uptake. Approximate locations of Oyashio Current, Kuroshio Current, Kuroshio Extension (KE), Kuroshio Recirculation (KR), Subtropical Countercurrent (STCC), Kuroshio front (KF), and Subtropical front (SF) are also illustrated (Kobashi et al., 2006; Kitamura et al., 2016; Oka et al., 2018). b. Monthly mean chlorophyll a (Chl a) concentration in May 2018 obtained from
https://oceancolor.gsfc.nasa.gov (while lines indicate the cruise track). c. Underway sea surface temperature (SST), atmospheric and water pCO2 from May 10 to June 7, 2018. For pCO2, 1 μatm=0.101 Pa. Discrete water pCO2 was calculated from dissolved inorganic carbon and total alkalinity values collected at the sampling stations shown in a. Discrete pCO2 at 28°C was calculated using the formula pCO228°C=pCO2×e0.0423(28−SST) following Takahashi et al. (2002).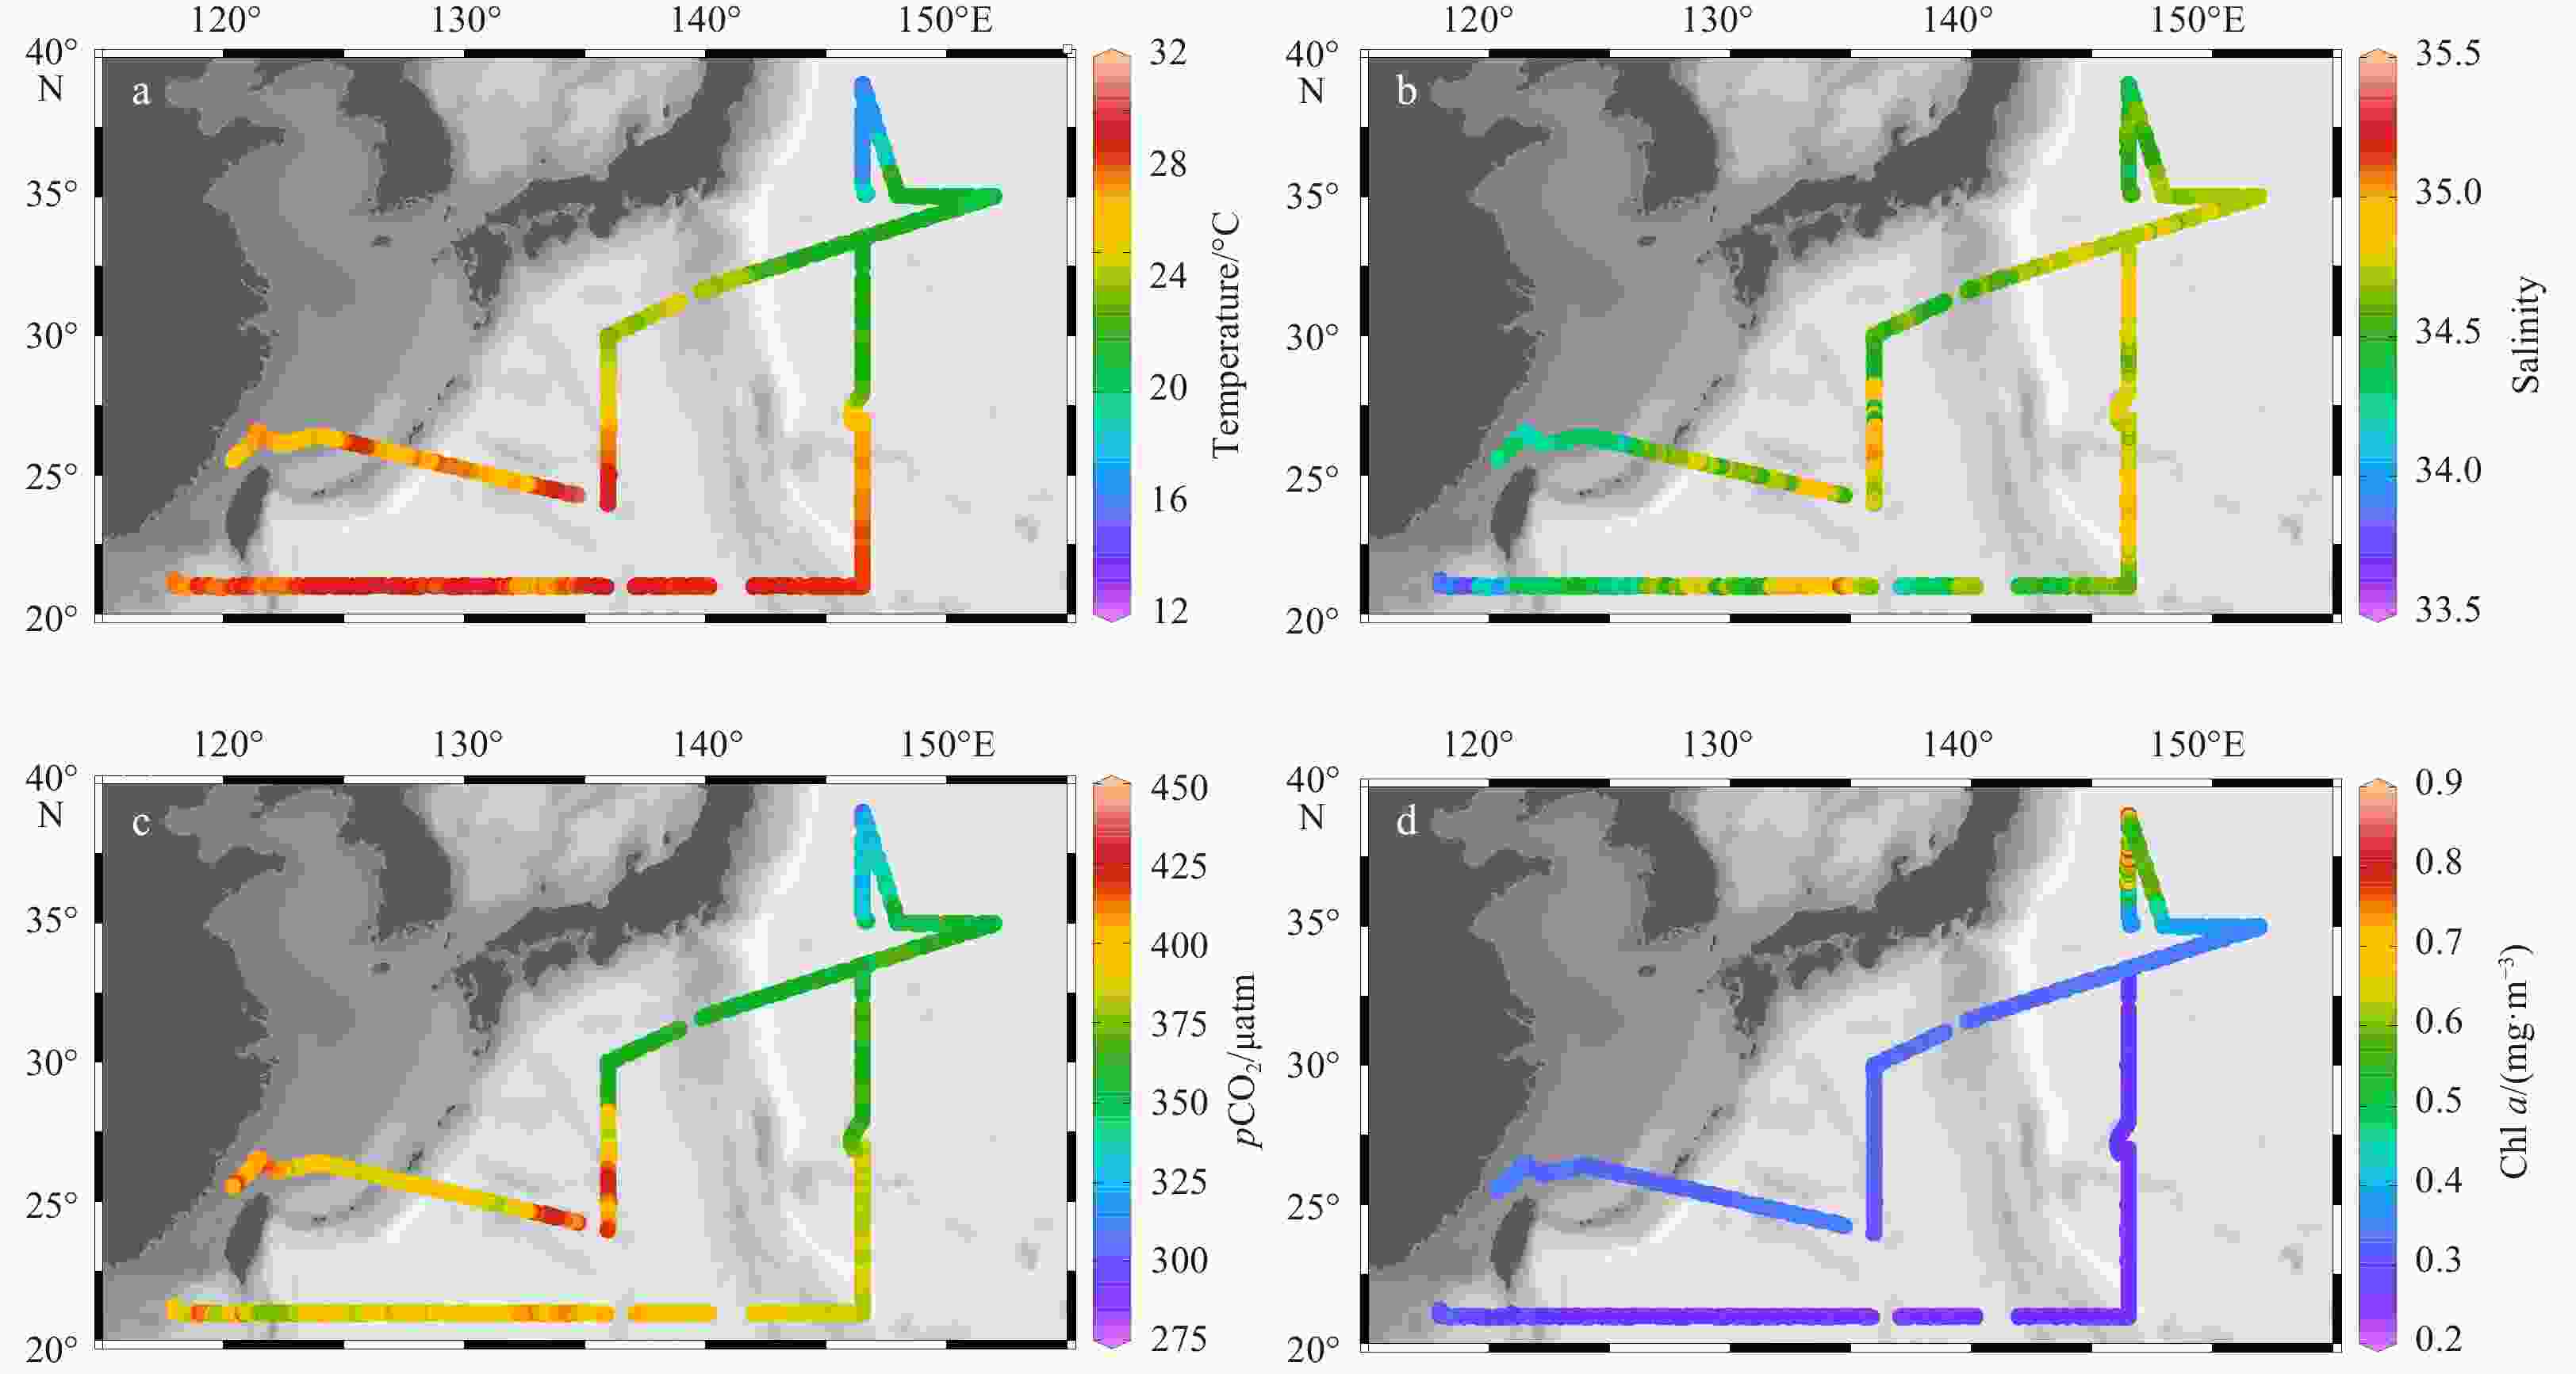
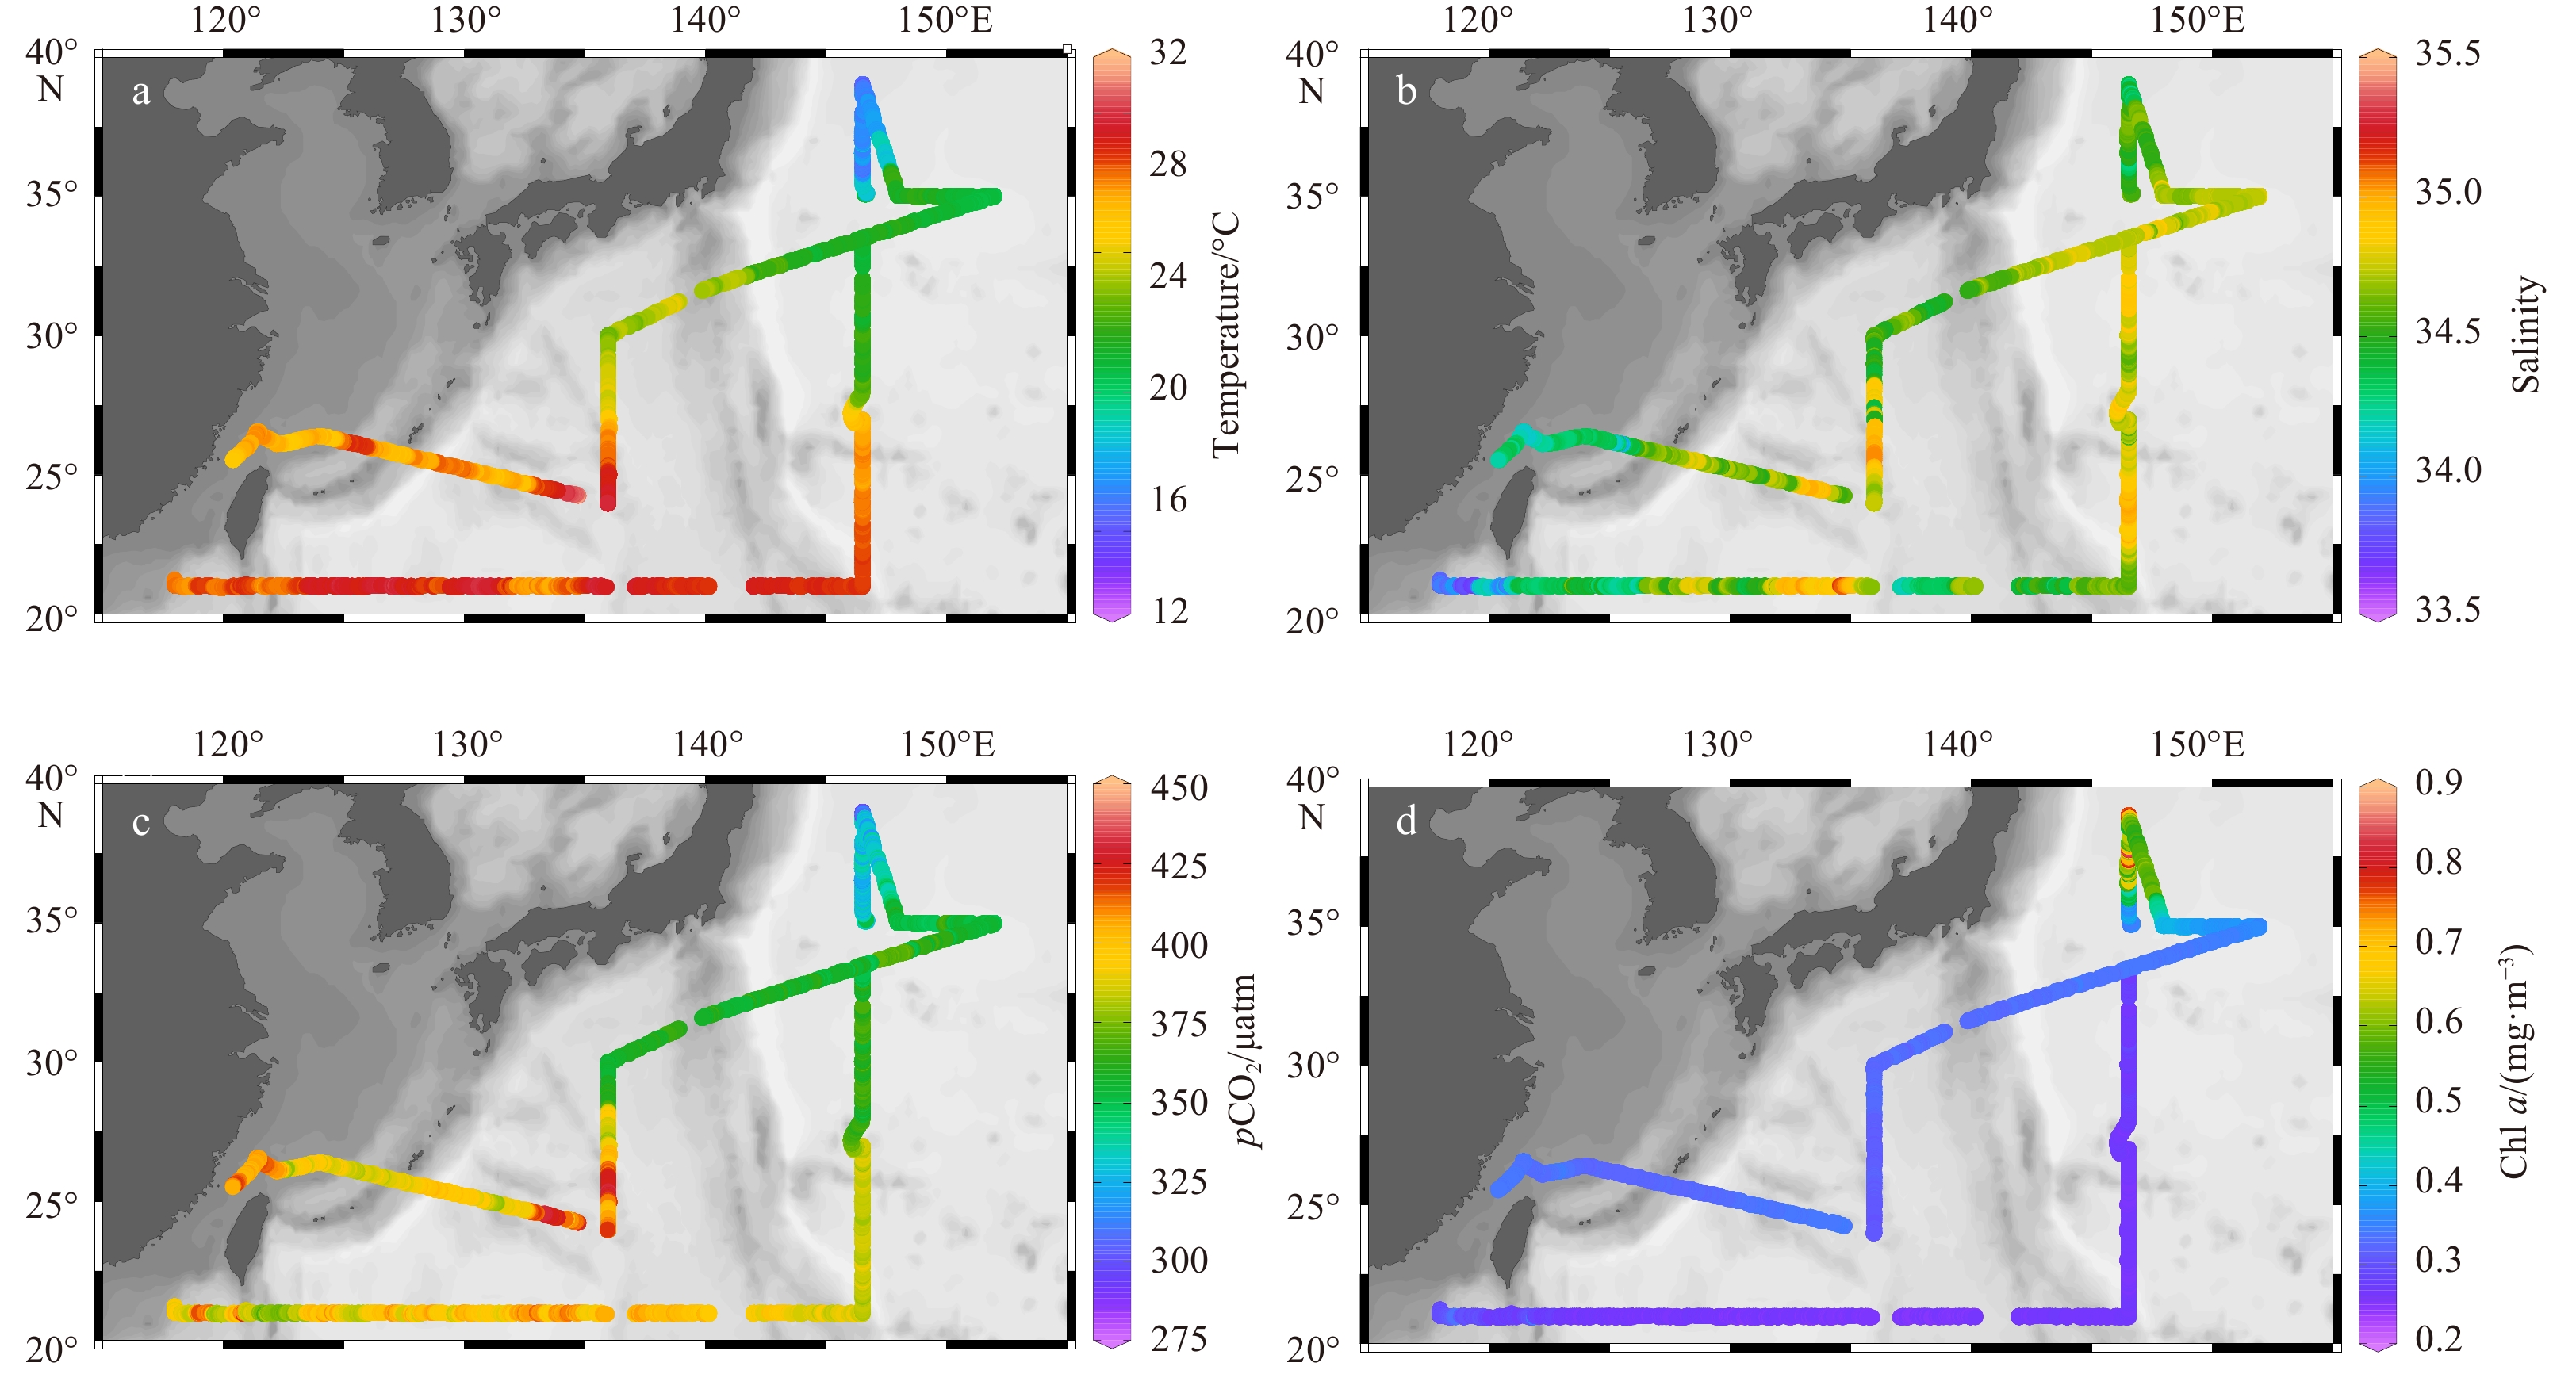
Figure 2. Distributions of sea surface temperature (a), salinity (b), pCO2 (c), and chlorophyll a (Chl a) (d) from mid-May to early June in 2018. For pCO2, 1 μatm=0.101 Pa.
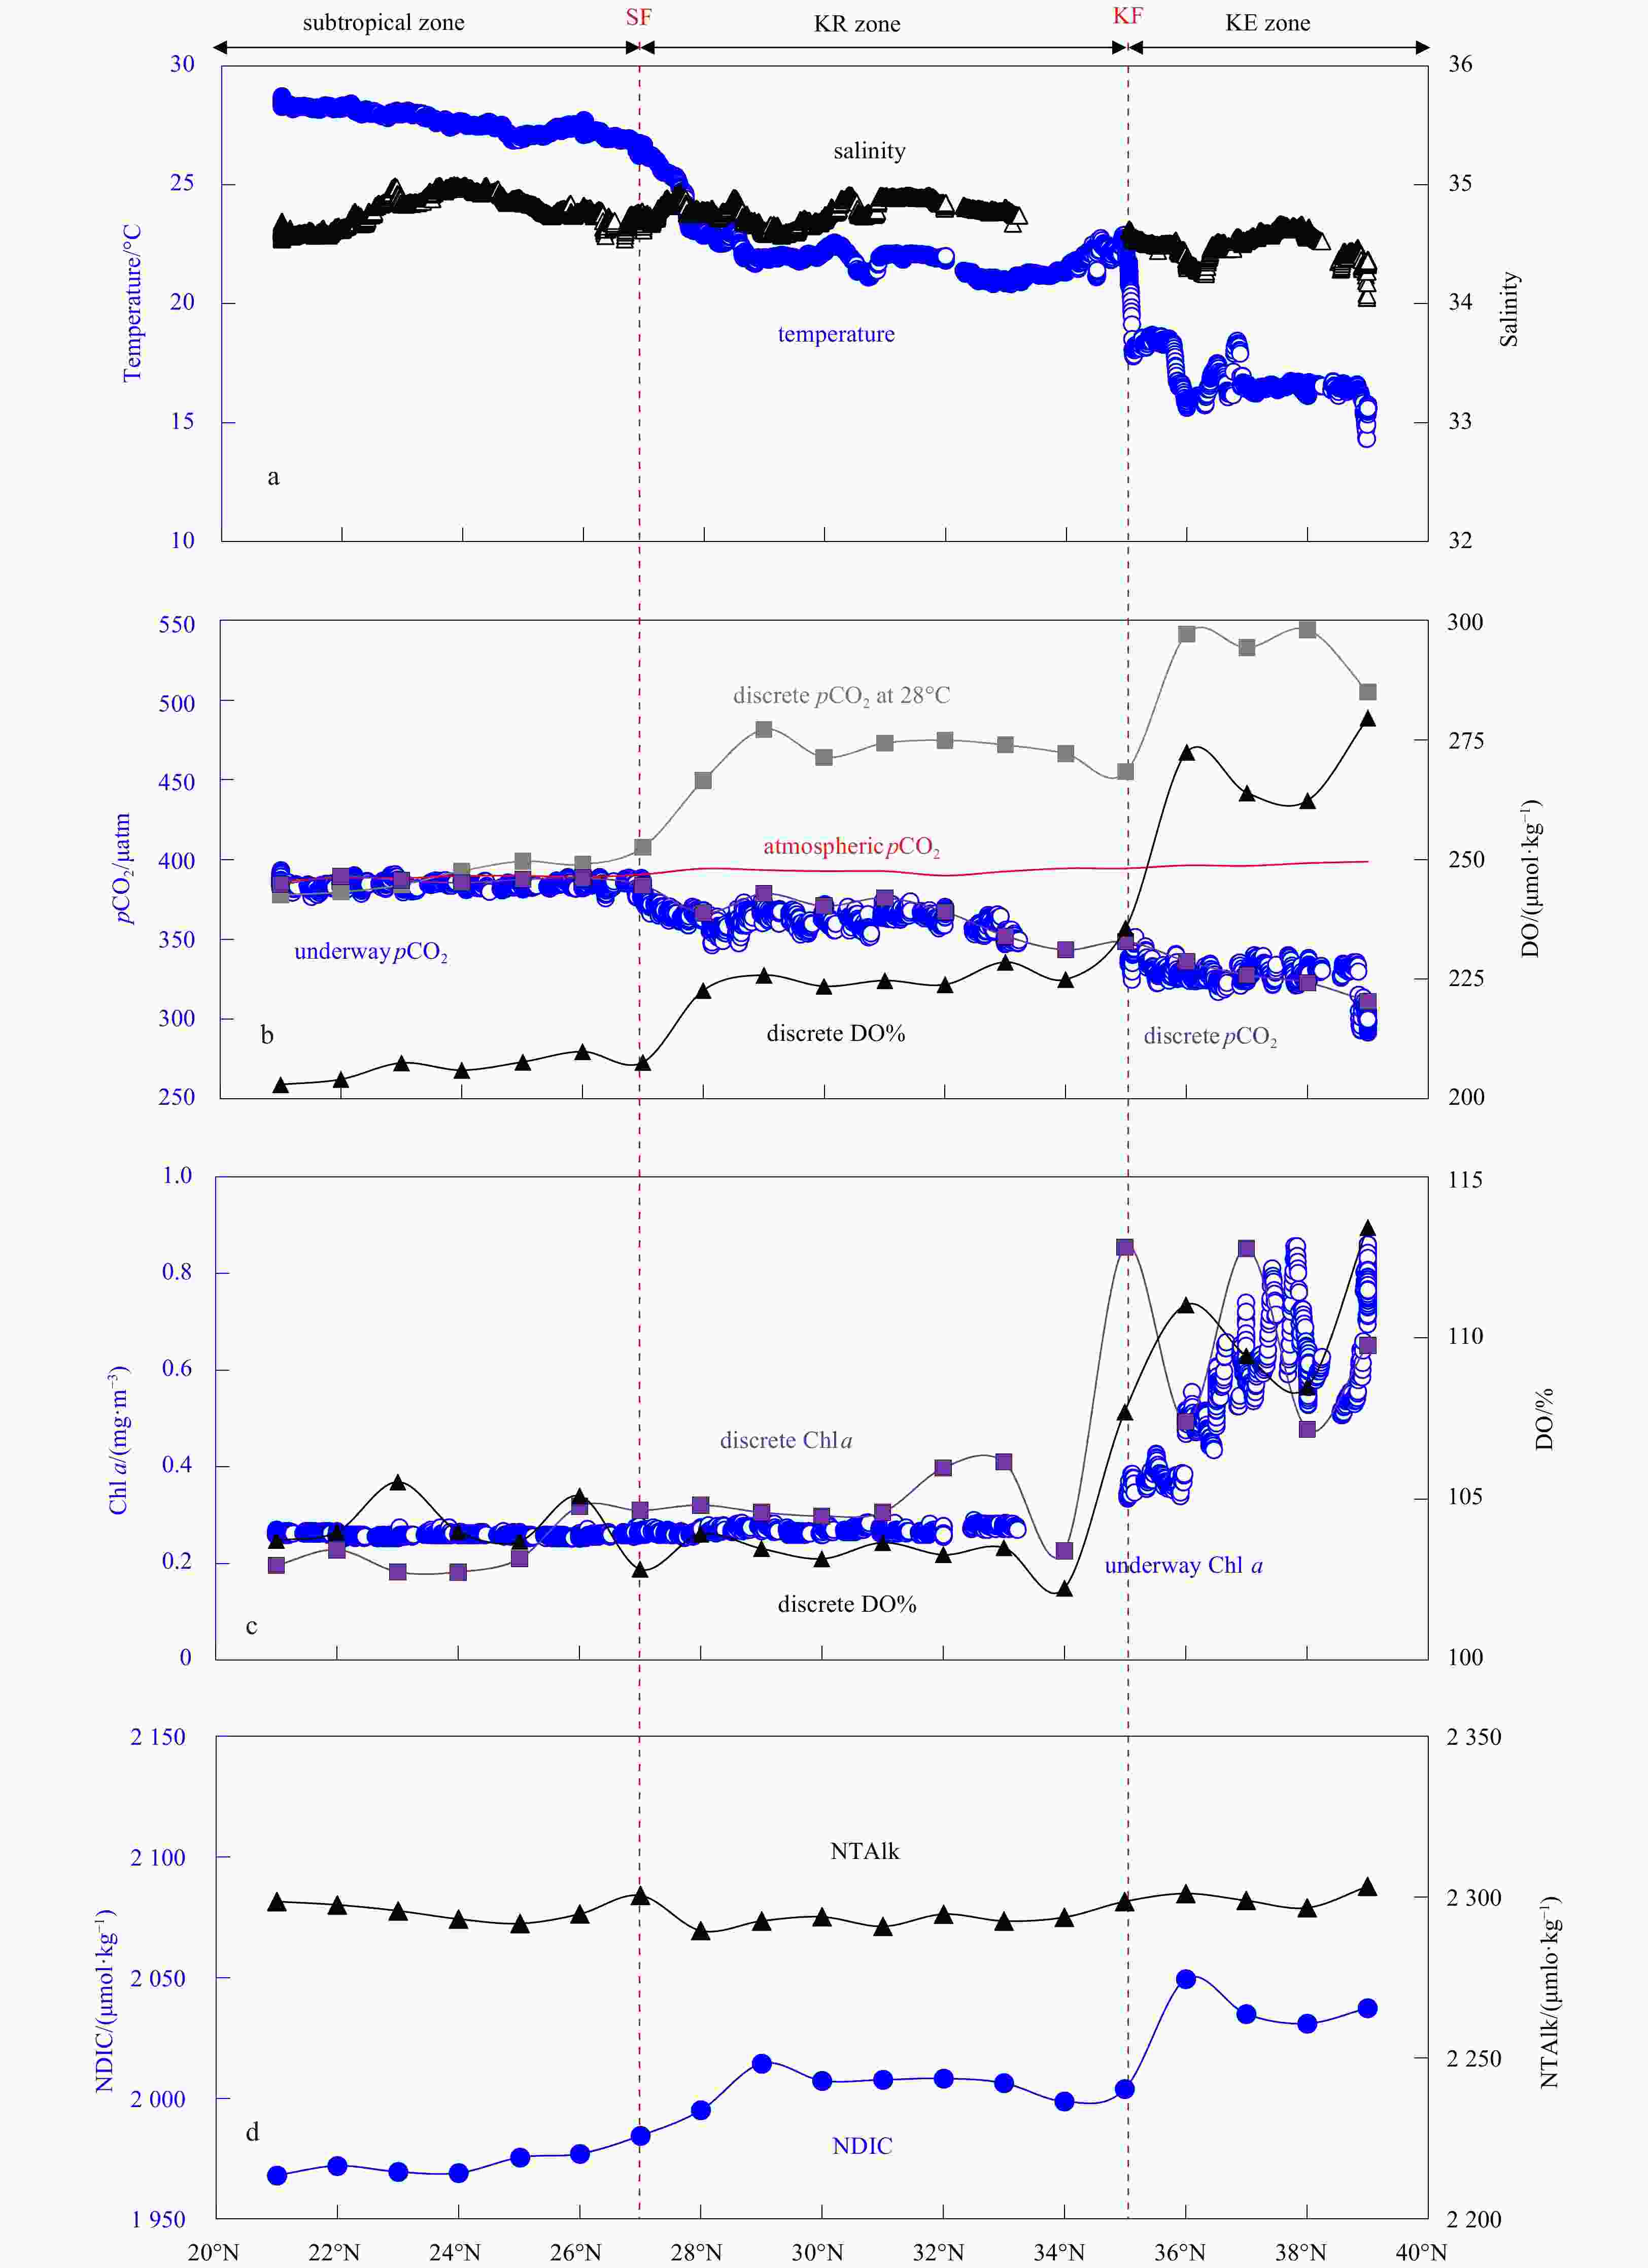
Figure 3. Latitudinal variations in underway and discreate parameters along the 147°E transect in May 2018. Discrete parameters were collected on stations. For pCO2, 1 μatm=0.101 Pa. Red vertical dashed lines denote the Kuroshio front (KF) and subtropical front (SF). KE: Kuroshio Extension, KR: Kuroshio Recirculation.
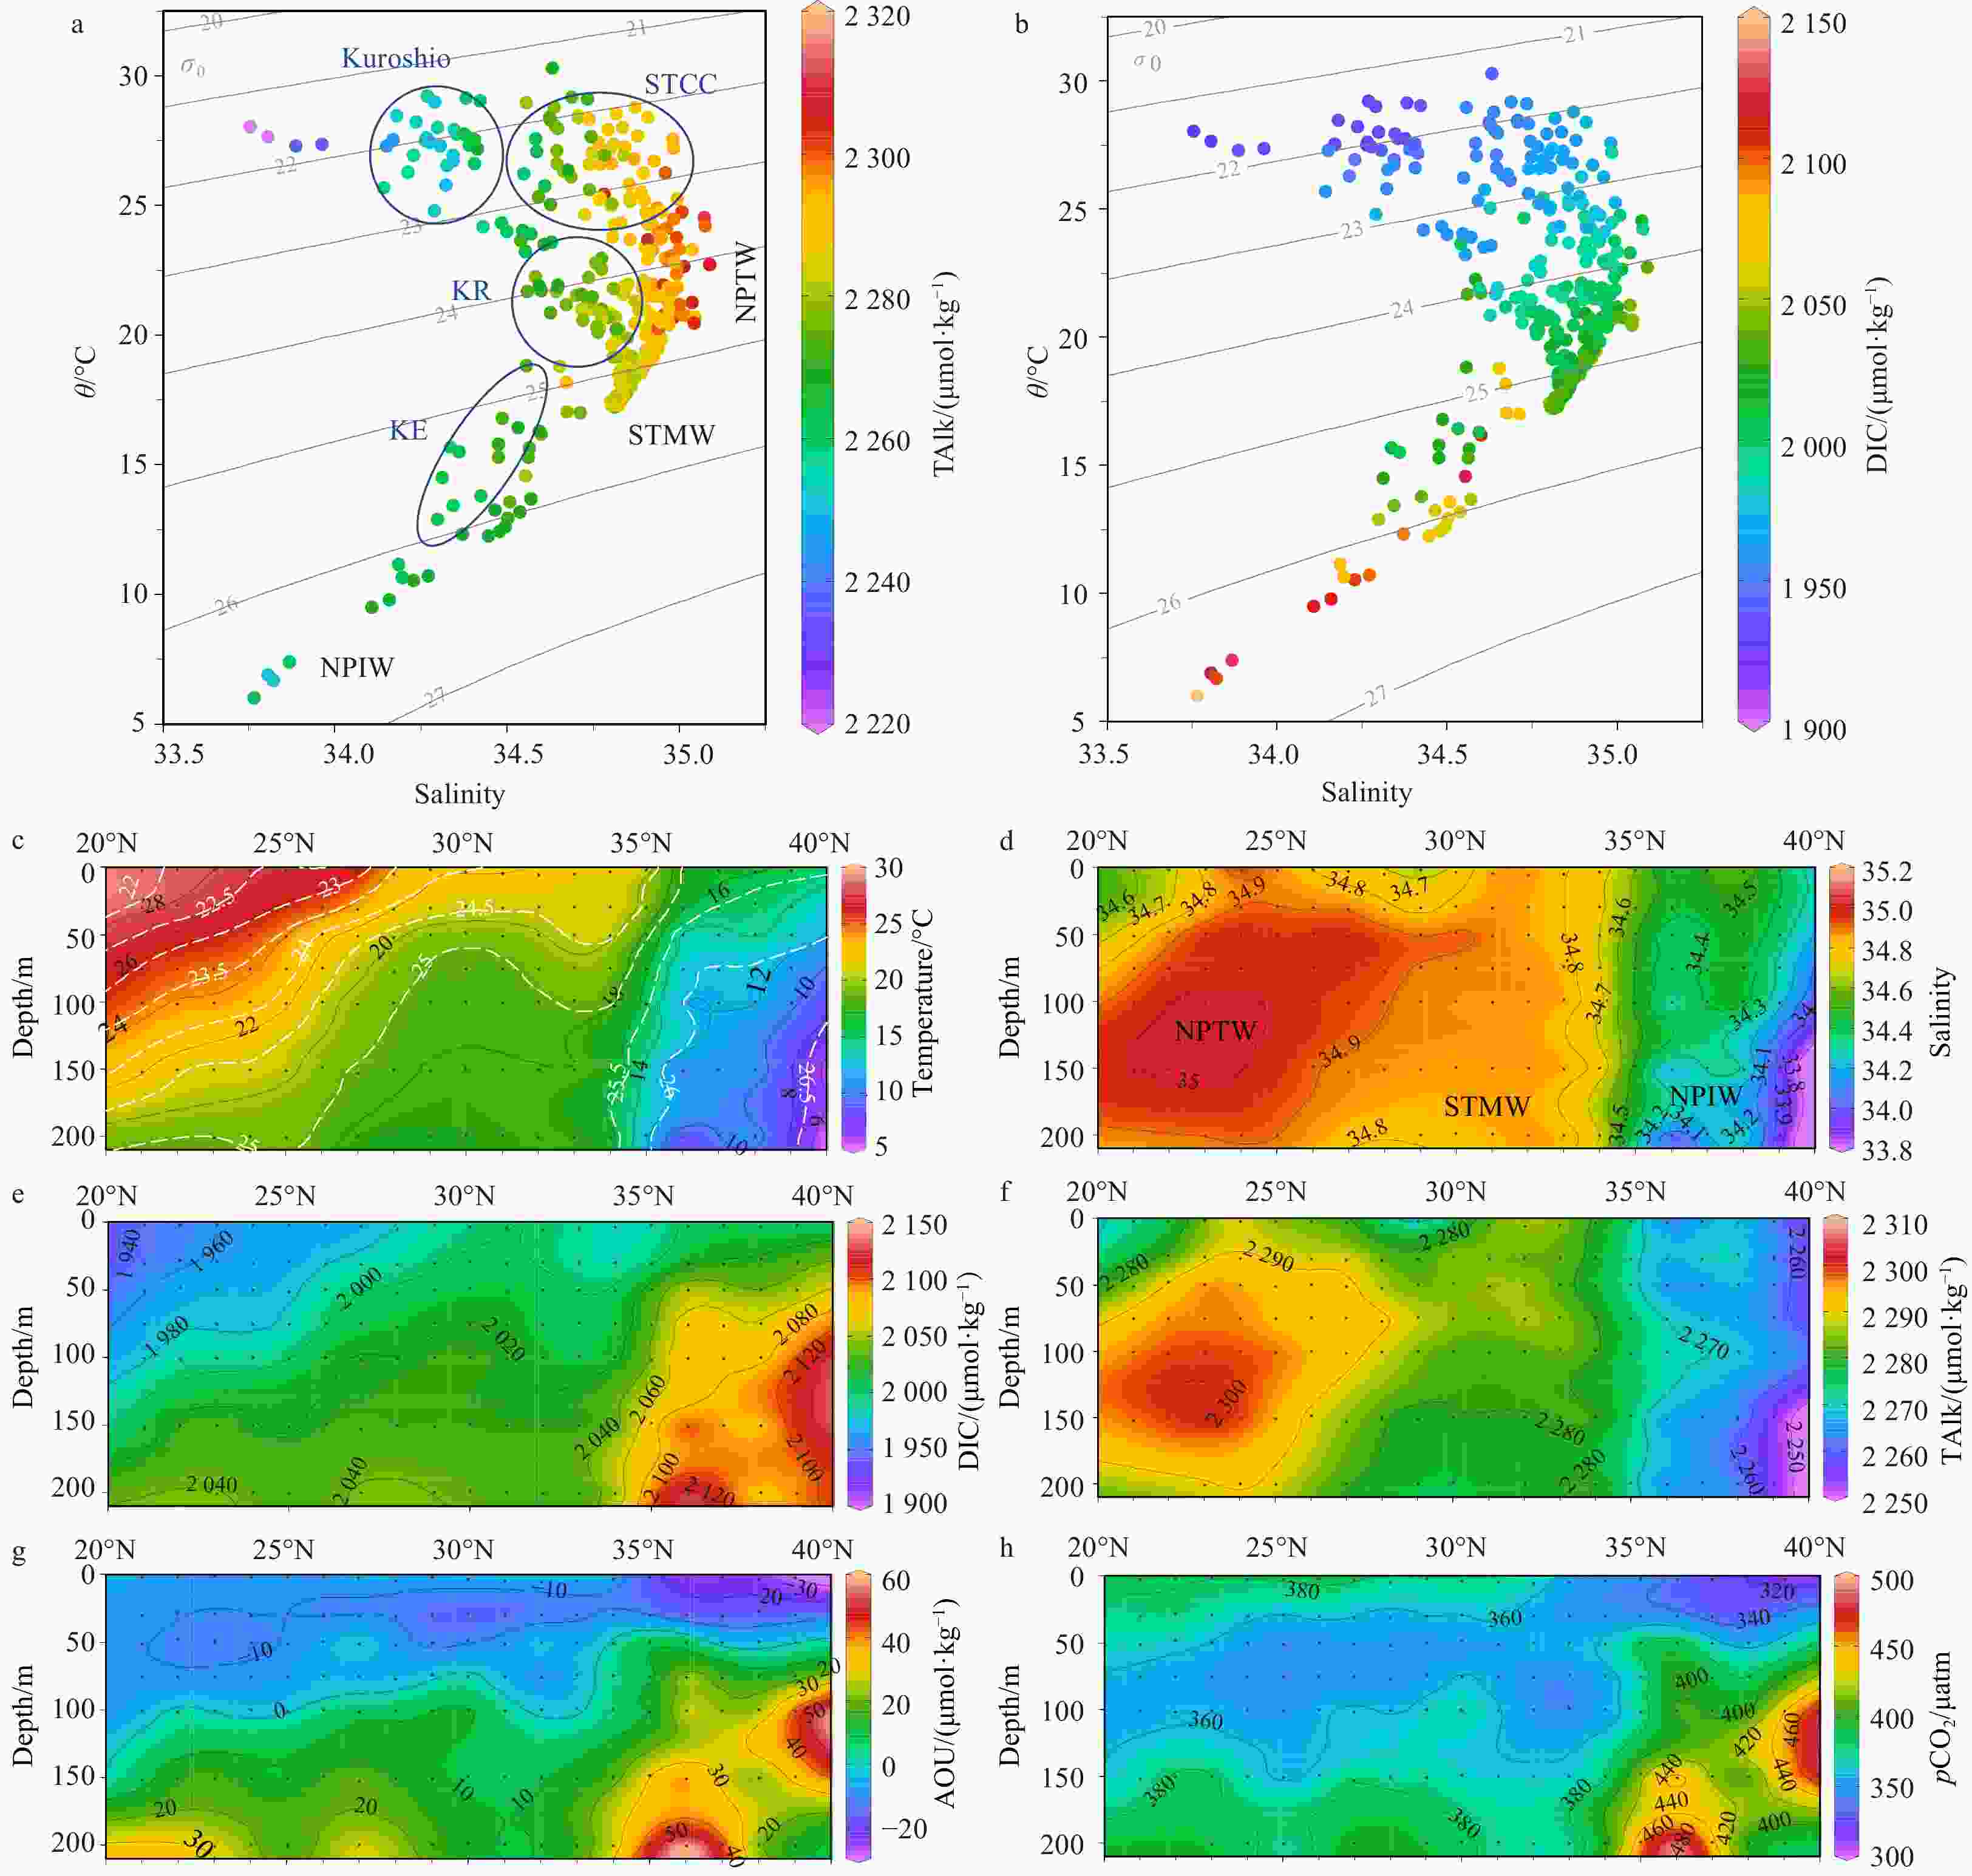
Figure 4. Water potential temperature (θ) versus salinity diagrams and vertical distributions. a, b. θ–S diagrams, c. temperature (black line) and potential density (σθ) (white line), d. salinity, e. DIC, f. TAlk, g. apparent oxygen utilization (AOU), and h. pCO2 along the 147°E transect in May 2018. In a and b, the contour lines represent σθ, and colors indicate TAlk and DIC in the upper 200 m. For pCO2, 1 μatm=0.101 Pa. KE: Kuroshio Extension, KR: Kuroshio Recirculation, STCC: Subtropical Countercurrent, NPTW: North Pacific Tropical Water, STMW: Subtropical Mode Water, NPIW: North Pacific Intermediate Water.

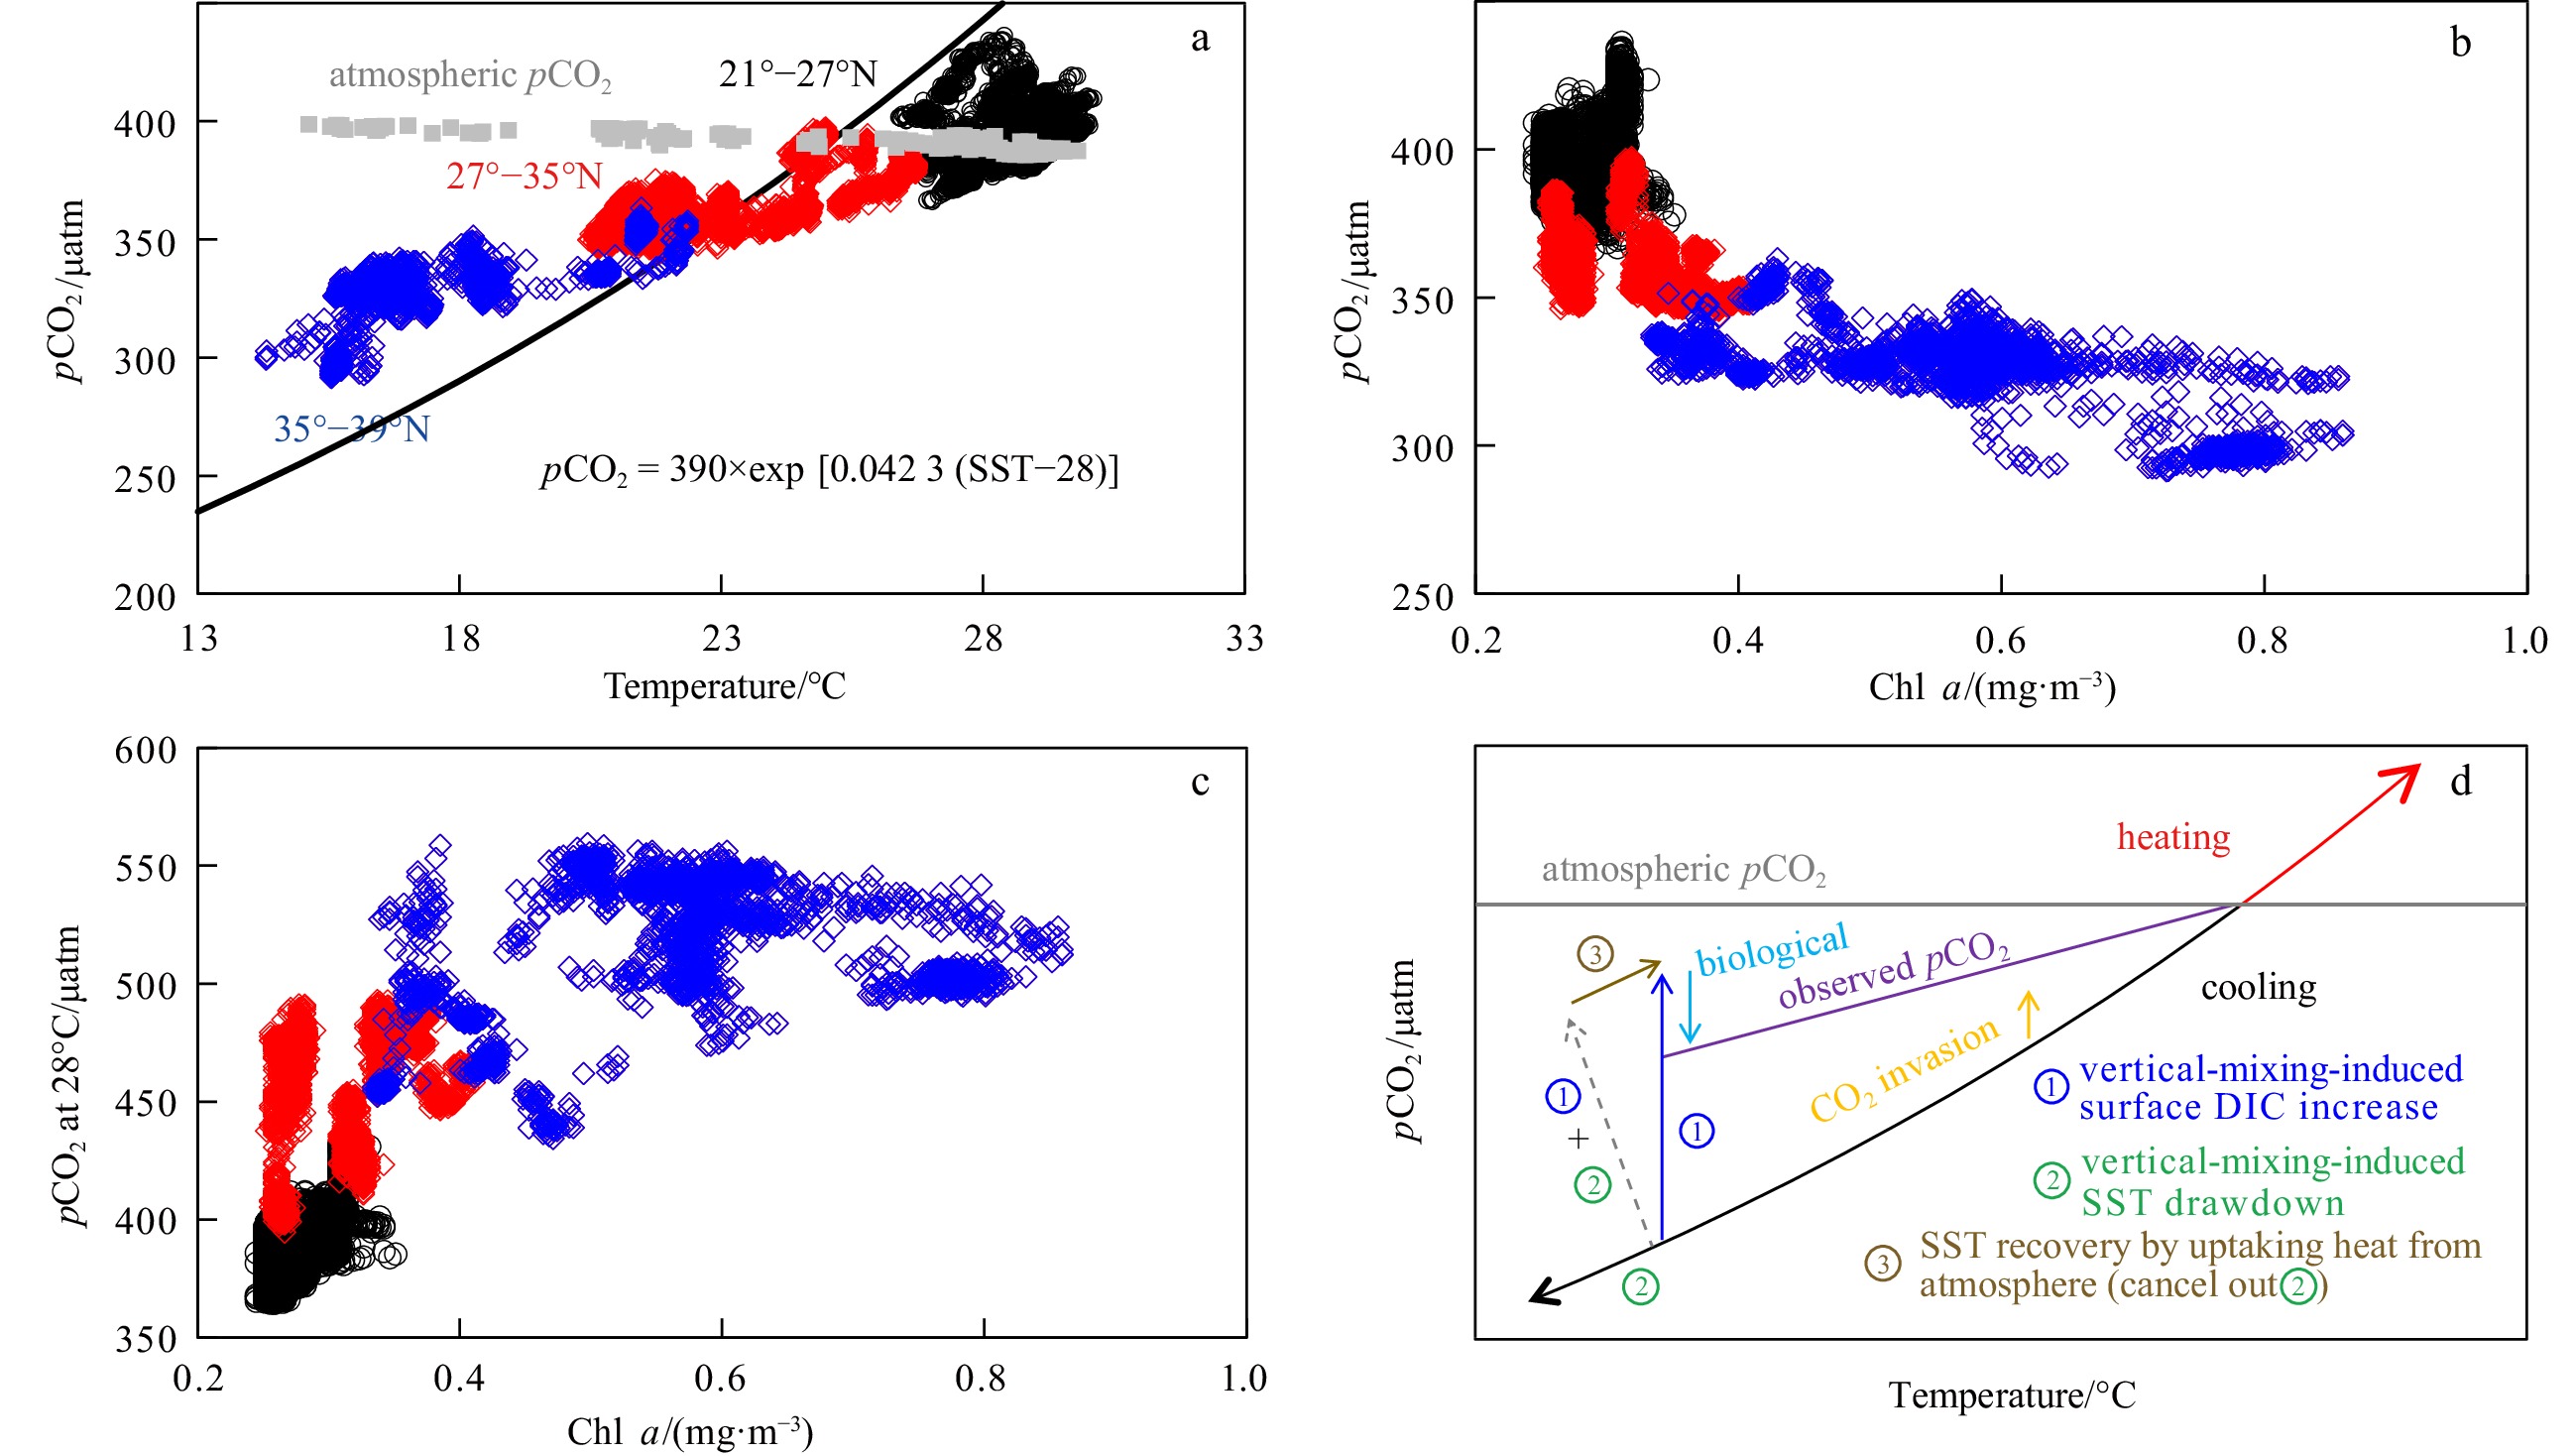
Figure 5. Plots of sea surface pCO2 versus temperature (a) and chlorophyll a (Chl a) (b), temperature-normalized surface pCO2 at 28°C versus Chl a (c), and major processes controlling surface pCO2 distribution (d) in the study area. For pCO2, 1 μatm=0.101 Pa. In a, black line represents temperature-driven variability of
$p{\rm{CO}}_2^{\rm{T}} $ =390×exp[0.0423(SST−28)], gray rectangles indicate atmospheric pCO2, and black circles indicate data obtained in the subtropical zone (21°−27°N), red and blue diamonds indicate data obtained in the KR zone (27°−35°N) and KE zone (35°−39°N), respectively. In d, Processes ① and ② indicate that vertical mixing results in DIC increase (increasing pCO2) and sea surface temperature (SST) drawdown (decreasing pCO2), respectively. Process ③ indicates SST recovery from vertical-mixing-induced SST drawdown as the mixed surface water absorbs heat from the atmosphere, thereby canceling out the effect of vertical-mixing-induced SST drawdown on surface pCO2.
Figure 6. Latitudinal distributions (21°−39°N, 147°E) of pCO2 difference between seawater and air (
$\Delta p{\rm{CO}}_2^{{\rm{sea-air}}} $ ) (a), partial changes in$\Delta p{\rm{CO}}_2^{{\rm{sea-air}}} $ related to individual biogeochemical processes of cooling (ΔpCO2Cool), biological activities ($\Delta p{\rm{CO}}_2^{{\rm{Bio}}} $ ), atmospheric pCO2 variations ($\Delta p{\rm{CO}}_2^{{\rm{Air}}} $ ), and the residual ($\Delta p{\rm{CO}}_2^{{\rm{Residual}}} $ ) (b), and latitudinal distributions of temperature-normalized pCO2 at 28°C (c), NDIC (d), and NTAlk (e) along the 147°E transect in May 2018. For pCO2, 1 μatm=0.101 Pa. White dashed lines indicate potential density and black dots indicate sampling layers. Red vertical dashed lines denote the Kuroshio front (KF) and subtropical front (SF). KE: Kuroshio Extension, KR: Kuroshio Recirculation.Table 1. Characteristics of water masses and surface currents in surface (2 m), 30 m, and 150/200 m layers along the 147°E (21°−39°N) transect and to the east of Luzon Strait (21°N, 123°−126°E) in May 2018
Zone Depth
/mWater Temperature
/°CSalinity AOU
/(µmol·kg−1)DIC
/(µmol·kg−1)TAlk
/(µmol·kg−1)pCO2
/µatmSubtropical zone
(21°−27°N)2 STCC 27.74±0.60 34.78±0.14 −9±2 1 960±9 2281±7 387±2 30 STCC 26.80±1.24 34.80±0.13 −9±1 1 963±12 2285±7 374±11 150 NPTW 20.41±1.38 34.97±0.06 14±8 2 025±16 2295±6 373±18 KR zone
(27°−35°N)2 KR 21.90±0.67 34.77±0.10 −7±1 1 992±7 2277±6 365±13 30 KR 21.00±0.50 34.80±0.07 −12±5 1 996±8 2281±4 354±12 200 STMW 17.58±0.39 34.82±0.02 17±8 2 036±6 2279±4 381±11 KE zone
(35°−39°N)2 KE 16.00±0.44 34.46±0.13 −26±6 2 006±4 2264±6 324±10 30 KE 14.74±0.99 34.42±0.12 −15±2 2 026±10 2266±8 339±13 200 NPIW 9.67±3.10 34.14±0.33 37±25 2 101±34 2263±6 437±63 East of Luzon Strait (21°N) 2 Kuroshio 28.81±0.57 34.33±0.07 −11±4 1 933±5 2256±4 388±7 30 Kuroshio 27.38±0.74 34.43±0.16 −11±1 1 941±14 2265±11 369±10 150 NPTW 21.94±0.91 34.96±0.04 12±14 2 011±21 2297±4 372±28 Note: STCC, Subtropical Countercurrent; NPTW, North Pacific Tropical Water; KR, Kuroshio Recirculation; KE, Kuroshio Extension; STMW, Subtropical Mode Water; NPIW, North Pacific Intermediate Water.  下载: 导出CSV
Table 2. Measured pCO2 (
$ p{\rm{CO}}_2^{{\rm{Meas}}} $ ), simulated temperature-dependent pCO2 ($ p{\rm{CO}}_2^{{\rm{T}}} $ ), and the difference between$ p{\rm{CO}}_2^{{\rm{Meas}}} $ and$p{\rm{CO}}_2^{{\rm{T}}} $ in areas to the south and north of the Kuroshio front from October 1990 to July 1991 and in May 2018Time South of the Kuroshio front North of the Kuroshio front Temperature
/°C$p{\rm{CO}}_2^{{\rm{T}}} $/μatm $p{\rm{CO}}_2^{{\rm{Meas}}} $/μatm $p{\rm{CO}}_2^{{\rm{Meas}}} $ −$p{\rm{CO}}_2^{{\rm{T}}} $/μatm Temperature
/°C$p{\rm{CO}}_2^{{\rm{T}}} $/μatm $p{\rm{CO}}_2^{{\rm{Meas}}} $/μatm $p{\rm{CO}}_2^{{\rm{Meas}}} $ −$p{\rm{CO}}_2^{{\rm{T}}} $/μatm Oct. 1990 26.0 314 330 16 26.0 314 330 16 Jan. 1991 20.0 244 290 46 14.5 193 330 137 Feb. 1991 18.5 229 300 71 14.5 193 320 127 May 1991 21.5 260 300 40 16.5 210 270 60 Jun. 1991 24.0 289 320 31 22.0 265 310 45 Jul. 1991 29.5 364 365 1 25.0 301 310 9 May 2018 21.7 262 358 57 16.1 207 321 114
下载: 导出CSV
Table 3. Partial changes in pCO2 difference related to individual biogeochemical processes of cooling (
$\Delta p{\rm{CO}}_2^{{\rm{Cool}}} $ ), biological activities ($\Delta p{\rm{CO}}_2^{{\rm{Bio}}} $ ), atmospheric pCO2 variations ($\Delta p{\rm{CO}}_2^{{\rm{Air}}} $ ), and the residual ($\Delta p{\rm{CO}}_2^{{\rm{Residual}}} $ )Zone $\Delta p{\rm{CO}}_2^{{\rm{sea-air}}} $/μatm $\Delta p{\rm{CO}}_2^{{\rm{Cool}}} $/μatm $\Delta p{\rm{CO}}_2^{{\rm{Bio}}} $/μatm $\Delta p{\rm{CO}}_2^{{\rm{Air}}} $/μatm $\Delta p{\rm{CO}}_2^{{\rm{Residual}}} $/μatm Subtropical zone −5±2 −4±10 −2±2 1±1 0±10 KR zone −31±10 −89±9 0±2 −3±2 61±7 KE zone −76±16 −154±4 −24±6 −7±1 109±8
下载: 导出CSV
Table 4. Air-sea equilibrium time for CO2 versus hydraulic residence time in the Kuroshio Extension zone
Air-sea equilibrium Temperature/°C DIC/(μmol·kg−1) CO2/(μmol·kg−1) Revelle factor Wind speed/(m·s−1) dML/m Equilibrium
time/d16.0±0.4 2006±4 11.8±0.4 10.5±0.2 5−10 50 139−554 Hydraulic residence Longitude Latitude Current speed/(m·s−1) Distance/km Residence time/d 140°−150°E 35°N 0.2−0.5 850 20−49
下载: 导出CSV
-
[1] Ayers J M, Lozier M S. 2012. Unraveling dynamical controls on the North Pacific carbon sink. Journal of Geophysical Research: Oceans, 117(C1): C01017. doi: 10.1029/2011JC007368 [2] Benson B B, Krause D. 1984. The concentration and isotopic fractionation of oxygen dissolved in freshwater and seawater in equilibrium with the atmosphere. Limnology and Oceanography, 29(3): 620–632. doi: 10.4319/lo.1984.29.3.0620 [3] Bingham F M. 1992. Formation and spreading of subtropical mode water in the North Pacific. Journal of Geophysical Research: Oceans, 97(C7): 11177–11189. doi: 10.1029/92JC01001 [4] Cai Weijun, Dai Minhan, Wang Yongchen, et al. 2004. The biogeochemistry of inorganic carbon and nutrients in the Pearl River estuary and the adjacent northern South China Sea. Continental Shelf Research, 24(12): 1301–1319. doi: 10.1016/j.csr.2004.04.005 [5] Cai Weijun, Wang Yongchen. 1998. The chemistry, fluxes, and sources of carbon dioxide in the estuarine waters of the Satilla and Altamaha Rivers, Georgia. Limnology and Oceanography, 43(4): 657–668. doi: 10.4319/lo.1998.43.4.0657 [6] Cannon G A. 1966. Tropical waters in the western Pacific Ocean, August–September 1957. Deep Sea Research and Oceanographic Abstracts, 13(6): 1139–1148. doi: 10.1016/0011-7471(66)90705-4 [7] Chierici M, Fransson A, Nojiri Y. 2006. Biogeochemical processes as drivers of surface fCO2 in contrasting provinces in the subarctic North Pacific Ocean. Global Biogeochemical Cycles, 20(1): GB1009. doi: 10.1029/2004GB002356 [8] de Boyer Montégut C, Madec G, Fischer A S, et al. 2004. Mixed layer depth over the global ocean: An examination of profile data and a profile-based climatology. Journal of Geophysical Research: Oceans, 109(C12): C12003. doi: 10.1029/2004JC002378 [9] Dickson A G. 1990. Standard potential of the reaction: AgCl(s)+1/2H2(g)=Ag(s)+HCl(aq), and the standard acidity constant of the ion ${\rm{HSO}}_4^- $ in synthetic sea water from 273.15 to 318.15 K. The Journal of Chemical Thermodynamics, 22(2): 113–127. doi: 10.1016/0021-9614(90)90074-Z[10] Dickson A G, Sabine C L, Christian J R. 2007. Guide to Best Practices for Ocean CO2 Measurements.Sidney, Canada: North Pacific Marine Science Organization [11] Fong M B, Dickson A G. 2019. Insights from GO-SHIP hydrography data into the thermodynamic consistency of CO2 system measurements in seawater. Marine Chemistry, 211: 52–63. doi: 10.1016/j.marchem.2019.03.006 [12] Friedlingstein P, O’Sullivan M, Jones M W, et al. 2020. Global carbon budget 2020. Earth System Science Data, 12(4): 3269–3340. doi: 10.5194/essd-12-3269-2020 [13] Henson S A, Humphreys M P, Land P E, et al. 2018. Controls on open-ocean North Atlantic ΔpCO2 at seasonal and interannual time scales are different. Geophysical Research Letters, 45(17): 9067–9076. doi: 10.1029/2018GL078797 [14] Honda M C, Kawakami H, Matsumoto K, et al. 2016. Comparison of sinking particles in the upper 200 m between subarctic Station K2 and subtropical Station S1 based on drifting sediment trap experiments. Journal of Oceanography, 72(3): 373–386. doi: 10.1007/s10872-015-0280-x [15] Hu Duxin, Wu Lixin, Cai Wenju, et al. 2015. Pacific western boundary currents and their roles in climate. Nature, 522(7556): 299–308. doi: 10.1038/nature14504 [16] Ishii M, Inoue H Y, Matsueda H, et al. 2001. Seasonal variation in total inorganic carbon and its controlling processes in surface waters of the western North Pacific subtropical gyre. Marine Chemistry, 75(1−2): 17–32. doi: 10.1016/S0304-4203(01)00023-8 [17] Jiang Zongpei, Cai Weijun, Chen Baoshan, et al. 2019. Physical and biogeochemical controls on pH dynamics in the northern Gulf of Mexico during summer hypoxia. Journal of Geophysical Research: Oceans, 124(8): 5979–5998. doi: 10.1029/2019JC015140 [18] Jones D C, Ito T, Takano Y, et al. 2014. Spatial and seasonal variability of the air-sea equilibration timescale of carbon dioxide. Global Biogeochemical Cycles, 28(11): 1163–1178. doi: 10.1002/2014GB004813 [19] Kitamura T, Nakano T, Sugimoto S. 2016. Decadal variations in mixed layer salinity in the Kuroshio Extension recirculation gyre region: Influence of precipitation during the warm season. Journal of Oceanography, 72(2): 167–175. doi: 10.1007/s10872-015-0317-1 [20] Knap A, Michaels A, Close A, et al. 1996. Protocols for the Joint Global Ocean Flux Study (JGOFS) core measurements. JGOFS Report Nr. 19, vi+170, Paris, France: UNESCO [21] Kobashi F, Mitsudera H, Xie Shangping. 2006. Three subtropical fronts in the North Pacific: Observational evidence for mode water-induced subsurface frontogenesis. Journal of Geophysical Research: Oceans, 111(C9): C09033. doi: 10.1029/2006JC003479 [22] Landschützer P, Gruber N, Bakker D C E. 2016. Decadal variations and trends of the global ocean carbon sink. Global Biogeochemical Cycles, 30(10): 1396–1417. doi: 10.1002/2015GB005359 [23] Landschützer P, Ilyina T, Lovenduski N S. 2019. Detecting regional modes of variability in observation-based surface ocean pCO2. Geophysical Research Letters, 46(5): 2670–2679. doi: 10.1029/2018GL081756 [24] Lee K, Kim T W, Byrne R H, et al. 2010. The universal ratio of boron to chlorinity for the North Pacific and North Atlantic Oceans. Geochimica et Cosmochimica Acta, 74(6): 1801–1811. doi: 10.1016/j.gca.2009.12.027 [25] Le Quéré C, Andrew R M, Friedlingstein P, et al. 2018. Global carbon budget 2018. Earth System Science Data, 10(4): 2141–2194. doi: 10.5194/essd-10-2141-2018 [26] Lewis E, Wallace D W R. 1998. Program developed for CO2 system calculations. Oak Ridge, TN, USA: Carbon Dioxide Information Analysis Center, Oak Ridge National Laboratory, US Department of Energy, ORNL/CDIAC-105s [27] Lueker T J, Dickson A G, Keeling C D. 2000. Oc ean pCO2 calc ulated from dissolved inorganic carbon, alkalinity, and equations for K1 and K2: Validation based on laboratory measurements of CO2 in gas and seawater at equilibrium. Marine Chemistry, 70(1−3): 105–119. doi: 10.1016/S0304-4203(00)00022-0 [28] Masuzawa J. 1969. Subtropical mode water. Deep Sea Research and Oceanographic Abstracts, 16(5): 463–472. doi: 10.1016/0011-7471(69)90034-5 [29] Matsumoto K, Abe O, Fujiki T, et al. 2016. Primary productivity at the time-series stations in the northwestern Pacific Ocean: is the subtropical station unproductive?. Journal of Oceanography, 72(3): 359–371. doi: 10.1007/s10872-016-0354-4 [30] Millero F J. 1995. Thermodynamics of the carbon dioxide system in the oceans. Geochimica et Cosmochimica Acta, 59(4): 661–677. doi: 10.1016/0016-7037(94)00354-O [31] Millero F J. 2010. Carbonate constants for estuarine waters. Marine and Freshwater Research, 61(2): 139–142. doi: 10.1071/MF09254 [32] Millero F J, Byrne R H, Wanninkhof R, et al. 1993. The internal consistency of CO2 measurements in the equatorial Pacific. Marine Chemistry, 44(2−4): 269–280. doi: 10.1016/0304-4203(93)90208-6 [33] Millero F J, Graham T B, Huang F, et al. 2006. Dissociation constants of carbonic acid in seawater as a function of salinity and temperature. Marine Chemistry, 100(1−2): 80–94. doi: 10.1016/j.marchem.2005.12.001 [34] Millero F J, Lee K, Roche M. 1998. Distribution of alkalinity in the surface waters of the major oceans. Marine Chemistry, 60(1-2): 111–130. doi: 10.1016/S0304-4203(97)00084-4 [35] Murata A M, Kaneko I, Nemoto K, et al. 1998. Spatial and temporal variations of surface seawater fCO2 in the Kuroshio off Japan. Marine Chemistry, 59(3-4): 189–200. doi: 10.1016/S0304-4203(97)00096-0 [36] Nakano H, Tsujino H, Hirabara M, et al. 2011. Uptake mechanism of anthropogenic CO2 in the Kuroshio Extension region in an ocean general circulation model. Journal of Oceanography, 67(6): 765–783. doi: 10.1007/s10872-011-0075-7 [37] Oka E, Ishii M, Nakano T, et al. 2018. Fifty years of the 137°E repeat hydrographic section in the western North Pacific Ocean. Journal of Oceanography, 74(2): 115–145. doi: 10.1007/s10872-017-0461-x [38] Ono H, Kosugi N, Toyama K, et al. 2019. Acceleration of ocean acidification in the western North Pacific. Geophysical Research Letters, 46(22): 13161–13169. doi: 10.1029/2019GL085121 [39] Orr J C, Epitalon J M, Dickson A G, et al. 2018. Routine uncertainty propagation for the marine carbon dioxide system. Marine Chemistry, 207: 84–107. doi: 10.1016/j.marchem.2018.10.006 [40] Orr J C, Epitalon J M, Gattuso J P. 2015. Comparison of ten packages that compute ocean carbonate chemistry. Biogeosciences, 12(5): 1483–1510. doi: 10.5194/bg-12-1483-2015 [41] Palevsky H I, Quay P D. 2017. Influence of biological carbon export on ocean carbon uptake over the annual cycle across the North Pacific Ocean. Global Biogeochemical Cycles, 31(1): 81–95. doi: 10.1002/2016GB005527 [42] Parsons T R, Maita Y, Lalli C M. 1984. A Manual of Chemical and Biological Methods for Seawater Analysis. Oxford: Pergamon Press [43] Pelletier G J, Lewis E, Wallace D W R. 2015. CO2SYS. XLS: A calculator for the CO2 system in seawater for Microsoft Excel/VBA, Version 24. Olympia, WA, USA: Washington State Department of Ecology. http://www.ecy.wa.gov/programs/eap/models.html [44] Prieto F JM, Millero F J. 2002. The values of pK1 + pK2 for the dissociation of carbonic acid in seawater. Geochimica et Cosmochimica Acta, 66(14): 2529–2540. doi: 10.1016/S0016-7037(02)00855-4 [45] Qiu Bo, Chen Shuiming. 2011. Effect of decadal Kuroshio Extension jet and eddy variability on the modification of North Pacific intermediate water. Journal of Physical Oceanography, 41(3): 503–515. doi: 10.1175/2010JPO4575.1 [46] Raimondi L, Matthews J B R, Atamanchuk D, et al. 2019. The internal consistency of the marine carbon dioxide system for high latitude shipboard and in situ monitoring. Marine Chemistry, 213: 49–70. doi: 10.1016/j.marchem.2019.03.001 [47] Redfield A C, Ketchum B H, Richards F A. 1963. The influence of organisms on the composition of sea-water. In: Hill M N, ed. The Sea, Vol. 2: Ideas and Observations on Progress in the Study of the Seas. New York, NY, USA: Interscience Publishers, 26–77 [48] Reimer J J, Cai Weijun, Xue Liang, et al. 2017. Time series pCO2 at a coastal mooring: Internal consistency, seasonal cycles, and interannual variability. Continental Shelf Research, 145: 95–108. doi: 10.1016/j.csr.2017.06.022 [49] Revelle R, Suess H E. 1957. Carbon dioxide exchange between atmosphere and ocean and the question of an increase of atmospheric CO2 during the past decades. Tellus, 9(1): 18–27. doi: 10.3402/tellusa.v9i1.9075 [50] Suga T, Hanawa K. 1990. The mixed-layer climatology in the northwestern part of the North Pacific subtropical gyre and the formation area of Subtropical Mode Water. Journal of Marine Research, 48(3): 543–566. doi: 10.1357/002224090784984669 [51] Sundquist E T, Plummer L N, Wigley T M L. 1979. Carbon dioxide in the ocean surface: the homogeneous buffer factor. Science, 204(4398): 1203–1205. doi: 10.1126/science.204.4398.1203 [52] Sweeney C, Gloor E, Jacobson A R, et al. 2007. Constraining global air-sea gas exchange for CO2 with recent bomb 14C measurements. Global Biogeochemical Cycles, 21(2): GB2015. doi: 10.1029/2006GB002784 [53] Takahashi T, Olafsson J, Goddard J G, et al. 1993. Seasonal variation of CO2 and nutrients in the high-latitude surface oceans: a comparative study. Global Biogeochemical Cycles, 7(4): 843–878. doi: 10.1029/93GB02263 [54] Takahashi T, Sutherland S C, Chipman D W, et al. 2014. Climatological distributions of pH, pCO2, total CO2, alkalinity, and CaCO3 saturation in the global surface ocean, and temporal changes at selected locations. Marine Chemistry, 164: 95–125. doi: 10.1016/j.marchem.2014.06.004 [55] Takahashi T, Sutherland S C, Wanninkhof R, et al. 2009. Climatological mean and decadal change in surface ocean pCO2, and net sea-air CO2 flux over the global oceans. Deep Sea Research Part II: Topical Studies in Oceanography, 56(8–10): 554–577. doi: 10.1016/j.dsr2.2008.12.009 [56] Takahashi T, Sutherland S C, Sweeney C, et al. 2002. Global sea–air CO2 flux based on climatological surface ocean pCO2, and seasonal biological and temperature effects. Deep Sea Research Part II: Topical Studies in Oceanography, 49(9−10): 1601–1622. doi: 10.1016/S0967-0645(02)00003-6 [57] Talley L D. 1993. Distribution and formation of North Pacific Intermediate Water. Journal of Physical Oceanography, 23(3): 517–537. doi: 10.1175/1520-0485(1993)023<0517:DAFONP>2.0.CO;2 [58] Talley L D, Nagata Y, Fujimura M, et al. 1995. North Pacific intermediate water in the Kuroshio/Oyashio mixed water region. Journal of Physical Oceanography, 25(4): 475–501. doi: 10.1175/1520-0485(1995)025<0475:NPIWIT>2.0.CO;2 [59] Uppström L R. 1974. The boron/chlorinity ratio of deep-sea water from the Pacific Ocean. Deep Sea Research and Oceanographic Abstracts, 21(2): 161–162. doi: 10.1016/0011-7471(74)90074-6 [60] Wang Z A, Cai Weijun. 2004. Carbon dioxide degassing and inorganic carbon export from a marsh-dominated estuary (the Duplin River): A marsh CO2 pump. Limnology and Oceanography, 49(2): 341–354. doi: 10.4319/lo.2004.49.2.0341 [61] Wanninkhof R. 1992. Relationship between wind speed and gas exchange over the ocean. Journal of Geophysical Research, 97(C5): 7373–7382. doi: 10.1029/92JC00188 [62] Weiss R F, Price B A. 1980. Nitrous oxide solubility in water and seawater. Marine Chemistry, 8(4): 347–359. doi: 10.1016/0304-4203(80)90024-9 [63] Wong G T F. 2012. Removal of nitrite interference in the Winkler determination of dissolved oxygen in seawater. Marine Chemistry, 130–131: 28–32,doi: 10.1016/j.marchem.2011.11.003 [64] Woosley R J. 2021. Evaluation of the temperature dependence of dissociation constants for the marine carbon system using pH and certified reference materials. Marine Chemistry, 229: 103914. doi: 10.1016/j.marchem.2020.103914 [65] Yasuda I, Okuda K, Shimizu Y. 1996. Distribution and modification of North Pacific intermediate water in the Kuroshio-Oyashio interfrontal zone. Journal of Physical Oceanography, 26(4): 448–465. doi: 10.1175/1520-0485(1996)026<0448:DAMONP>2.0.CO;2 [66] Yoshida K, Kidokoro T. 1967. A subtropical counter-curreut in the North Pacific: An eastward flow near the subtropical convergence. Journal of the Oceanographical Society of Japan, 23(2): 88–91. doi: 10.5928/kaiyou1942.23.88 [67] Zeebe R E, Wolf-Gladrow D. 2001. Chapter 1 Equilibrium. In: Zeebe R E, Wolf-Gladrow D, eds. CO2 in Seawater: Equilibrium, Kinetics, Isotopes. Elsevier Oceanography Series, 65: 1–84. doi: 10.1016/S0422-9894(01)80002-7 -


 点击查看大图
计量
- 文章访问数: 773
- HTML全文浏览量: 278
- PDF下载量: 70
- 被引次数: 0

