

-
Abstract: Based on a two-level nested model from the global ocean to the western Pacific and then to the South China Sea (SCS), the high-resolution SCS deep circulation is numerically investigated. The SCS deep circulation shows a basin-scale cyclonic structure with a strong southward western boundary current in summer (July), a northeast-southwest through-flow pattern across the deep basin without a western boundary current in winter (January), and a transitional pattern in spring and autumn. The sensitivity model experiments illustrate that the Luzon Strait deep overflow is the main factor controlling the seasonal variation in the SCS deep circulation. The SCS surface wind can significantly influence the SCS deep circulation in winter. The Luzon Strait deep overflow transport from the Pacific into the SCS ranges from 0.68×10⁶ m3/s to 1.83×10⁶ m3/s, reaching its maximum in summer (July, up to 1.83×10⁶ m3/s), less in autumn and winter, and the minimum in spring (May, 0.68×10⁶ m3/s). In summer, the strong Luzon Strait deep overflow dominates the SCS deep circulation when the role of the SCS surface wind is small. In winter, the weaker Luzon Strait deep overflow and SCS surface wind jointly drive the SCS deep circulation into a northeast-southwest through-flow pattern. The potential vorticity (PV) dissipation in the SCS deep basin reaches its maximum (−0.122 m2/s2) in May and its minimum (−0.380 m2/s2) in July.
-
Key words:
- South China Sea /
- deep sea circulation /
- deep overflow /
- surface wind /
- potential vorticity
-

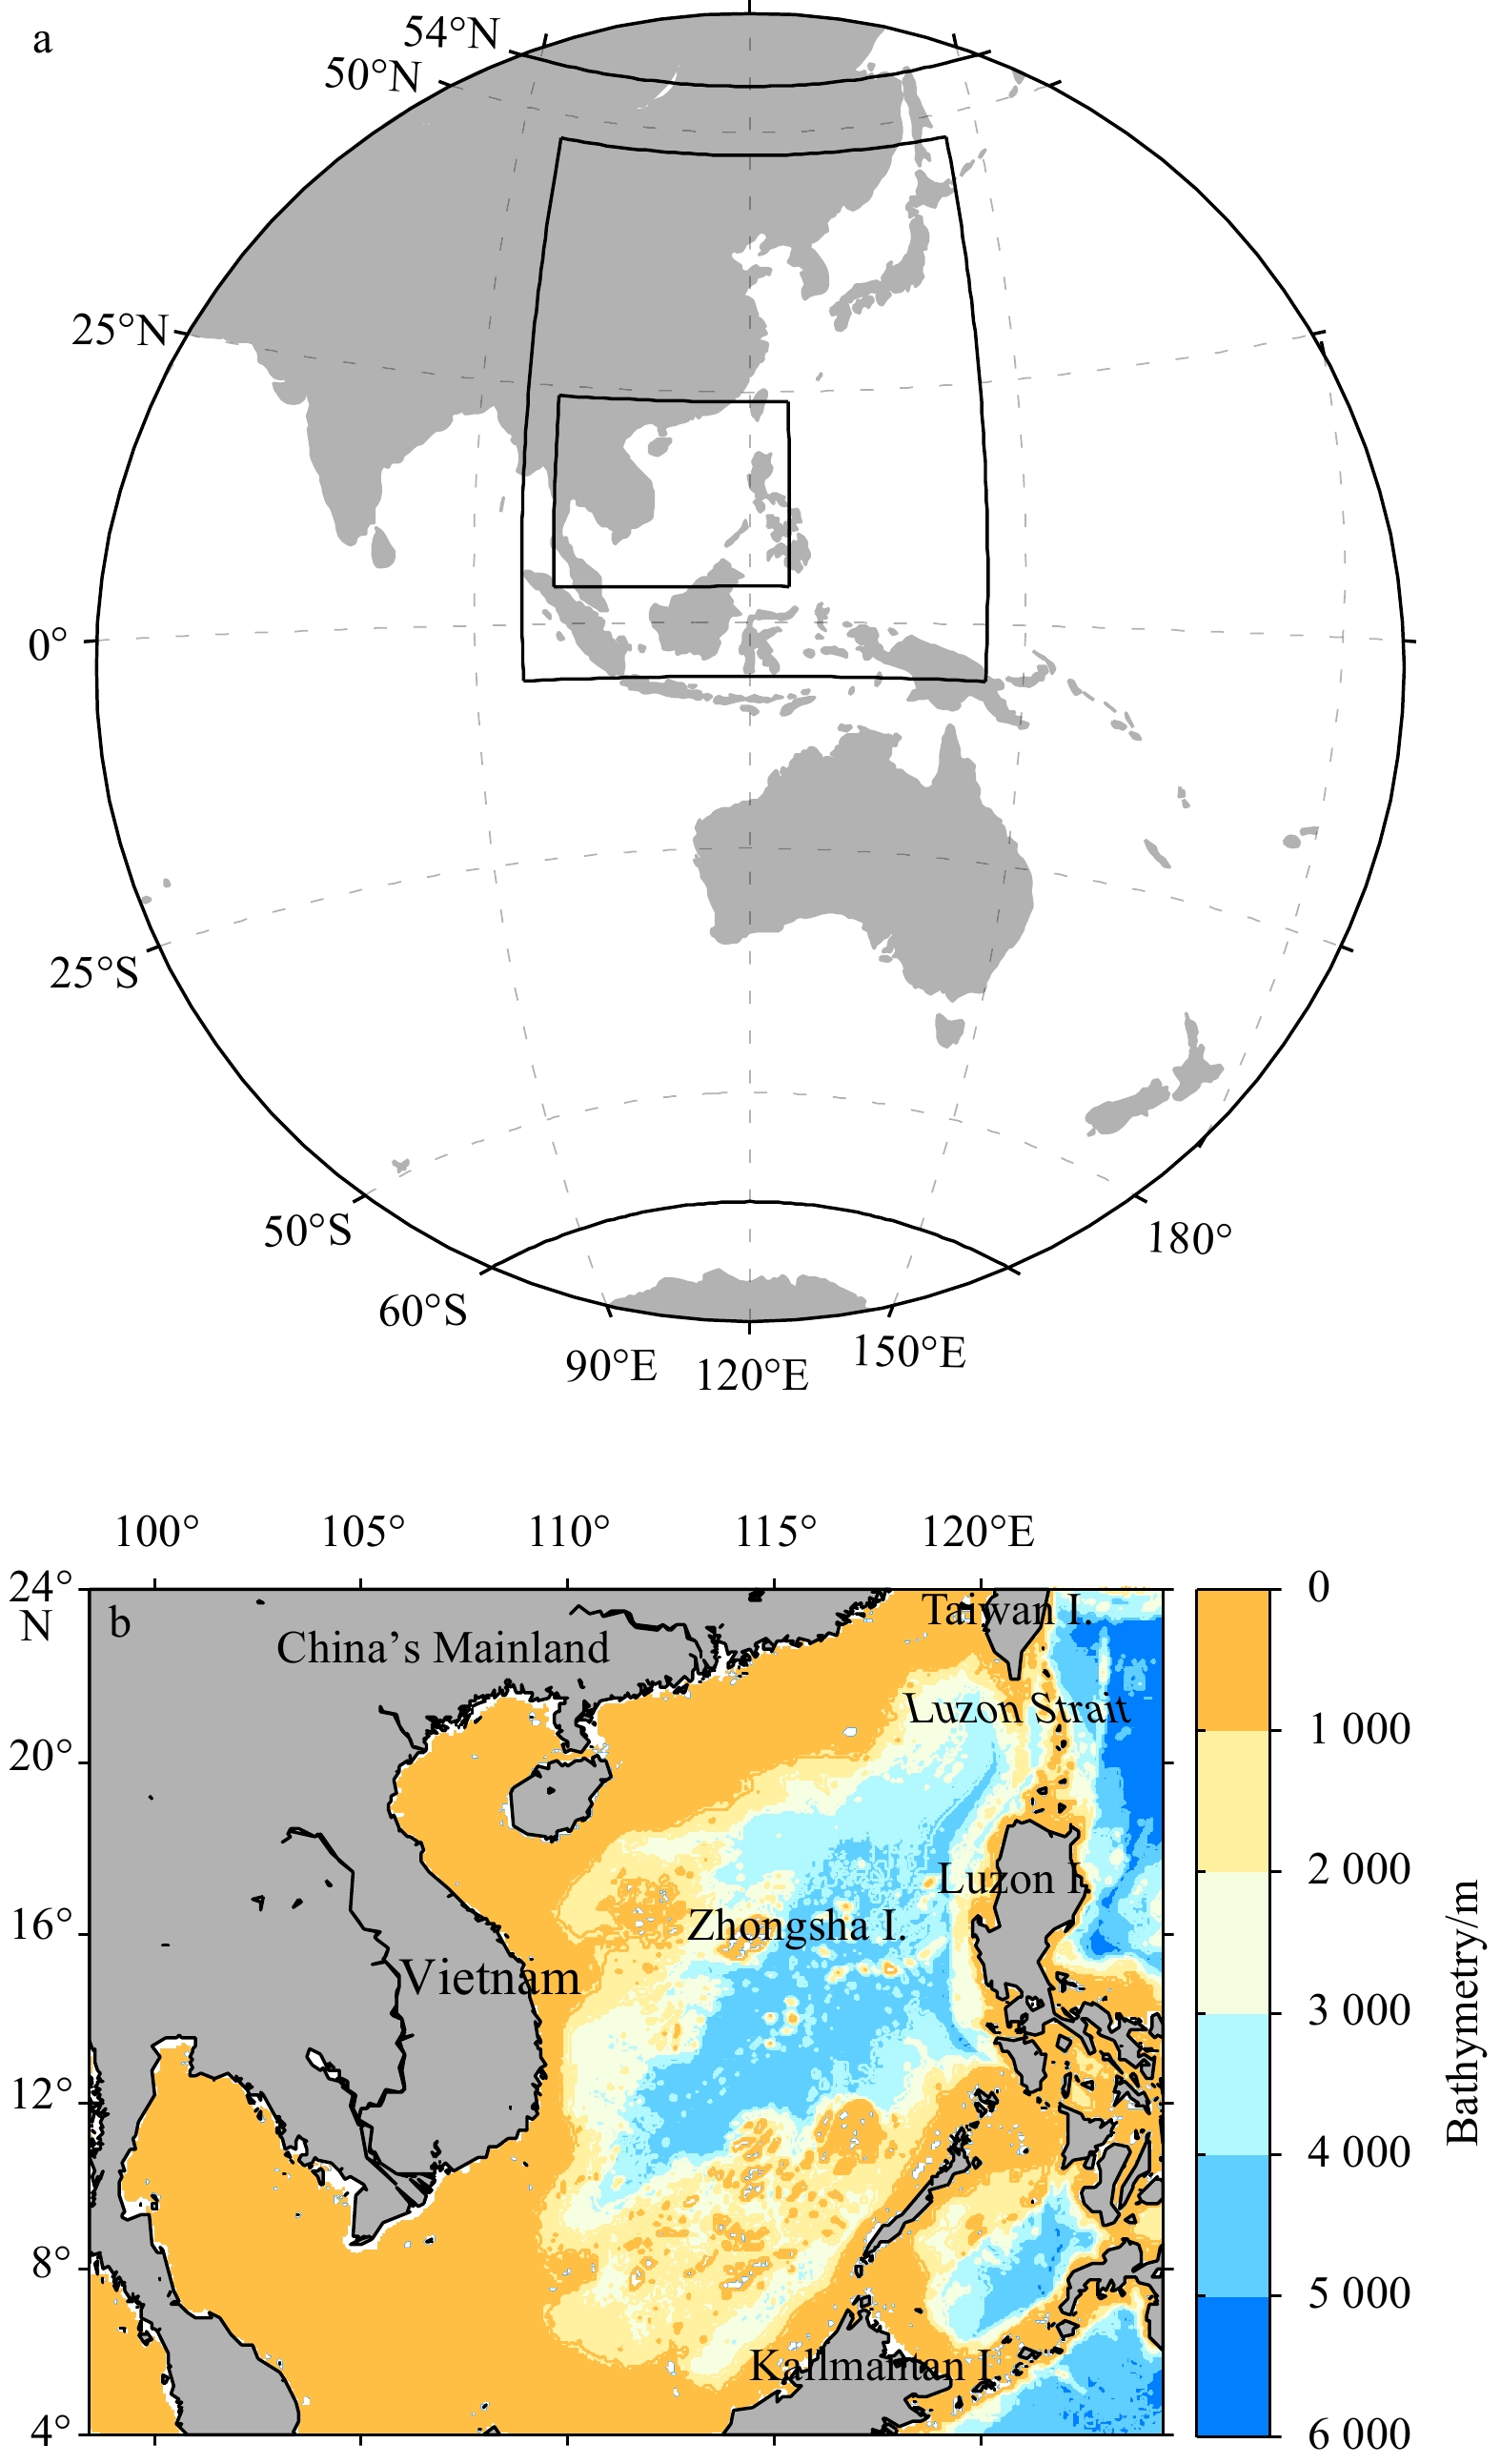
Figure 1. The two-level nested simulation domains (a) and the bathymetry of the SCS model (b). Zhongsha Island is shown in b.
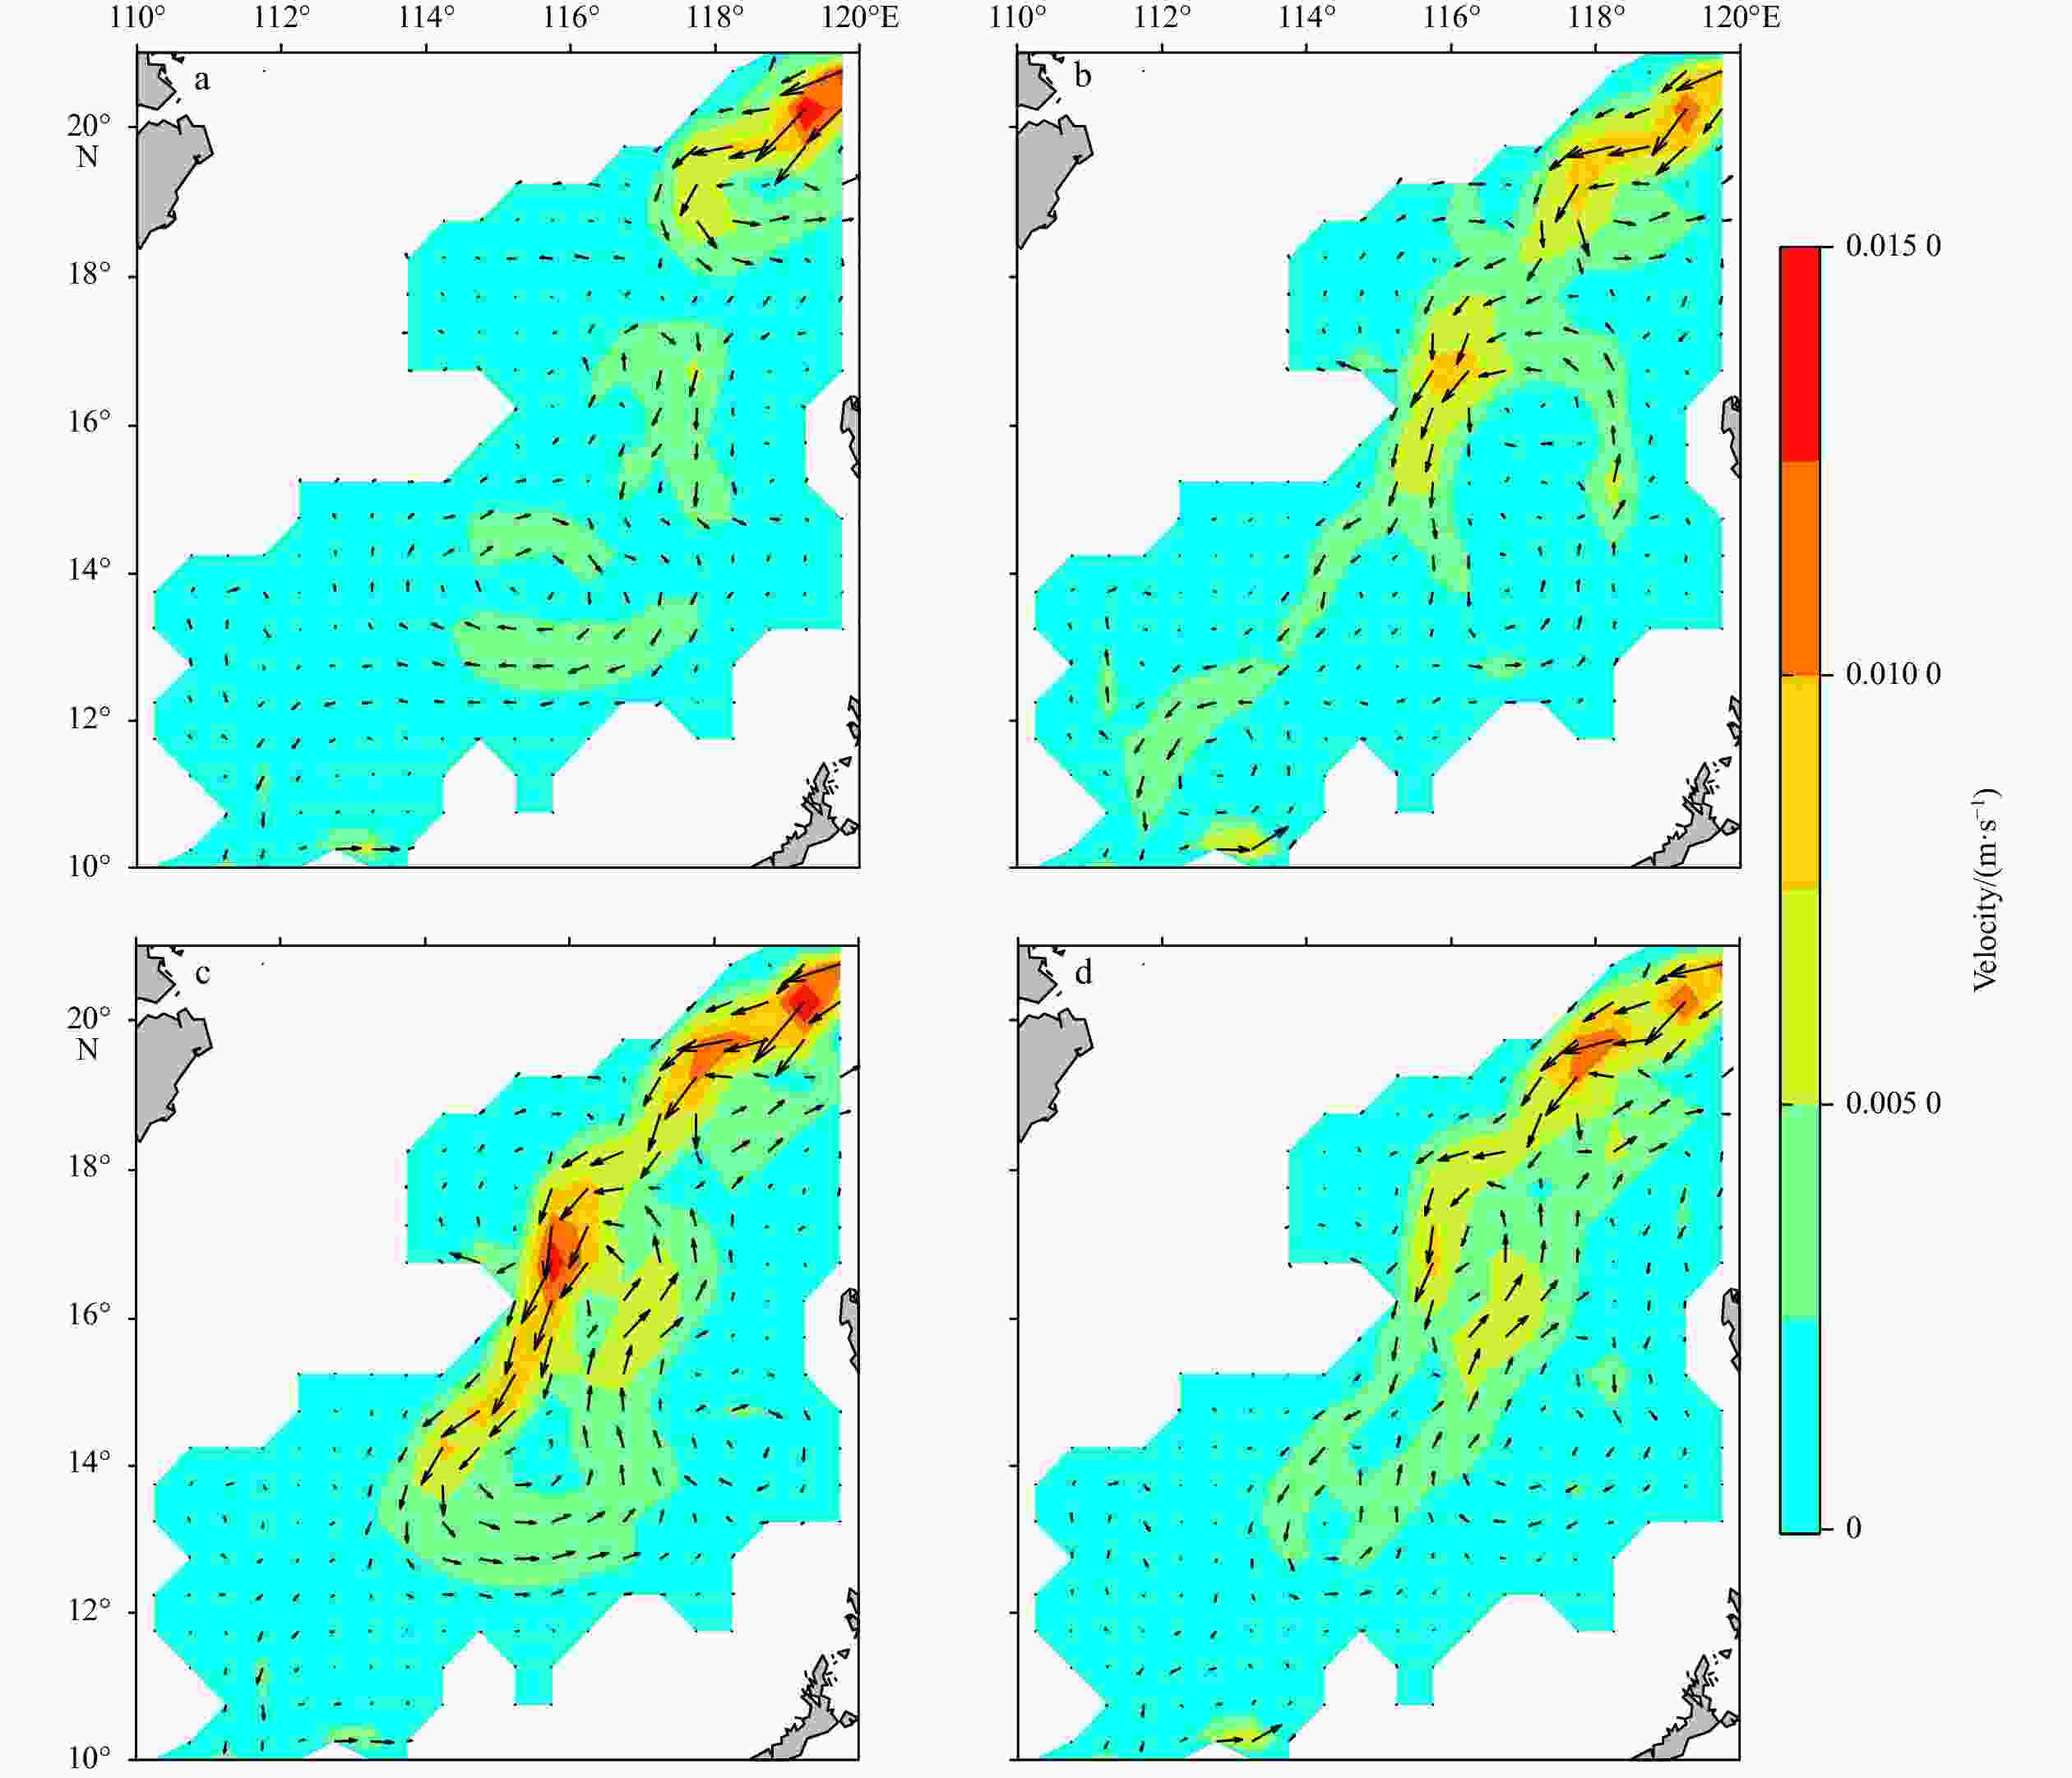
Figure 2. The climatological monthly mean SCS deep circulation of SODA data (vertically averaged downward from 2 000 m depth) in January (a), April (b), July (c) and October (d).
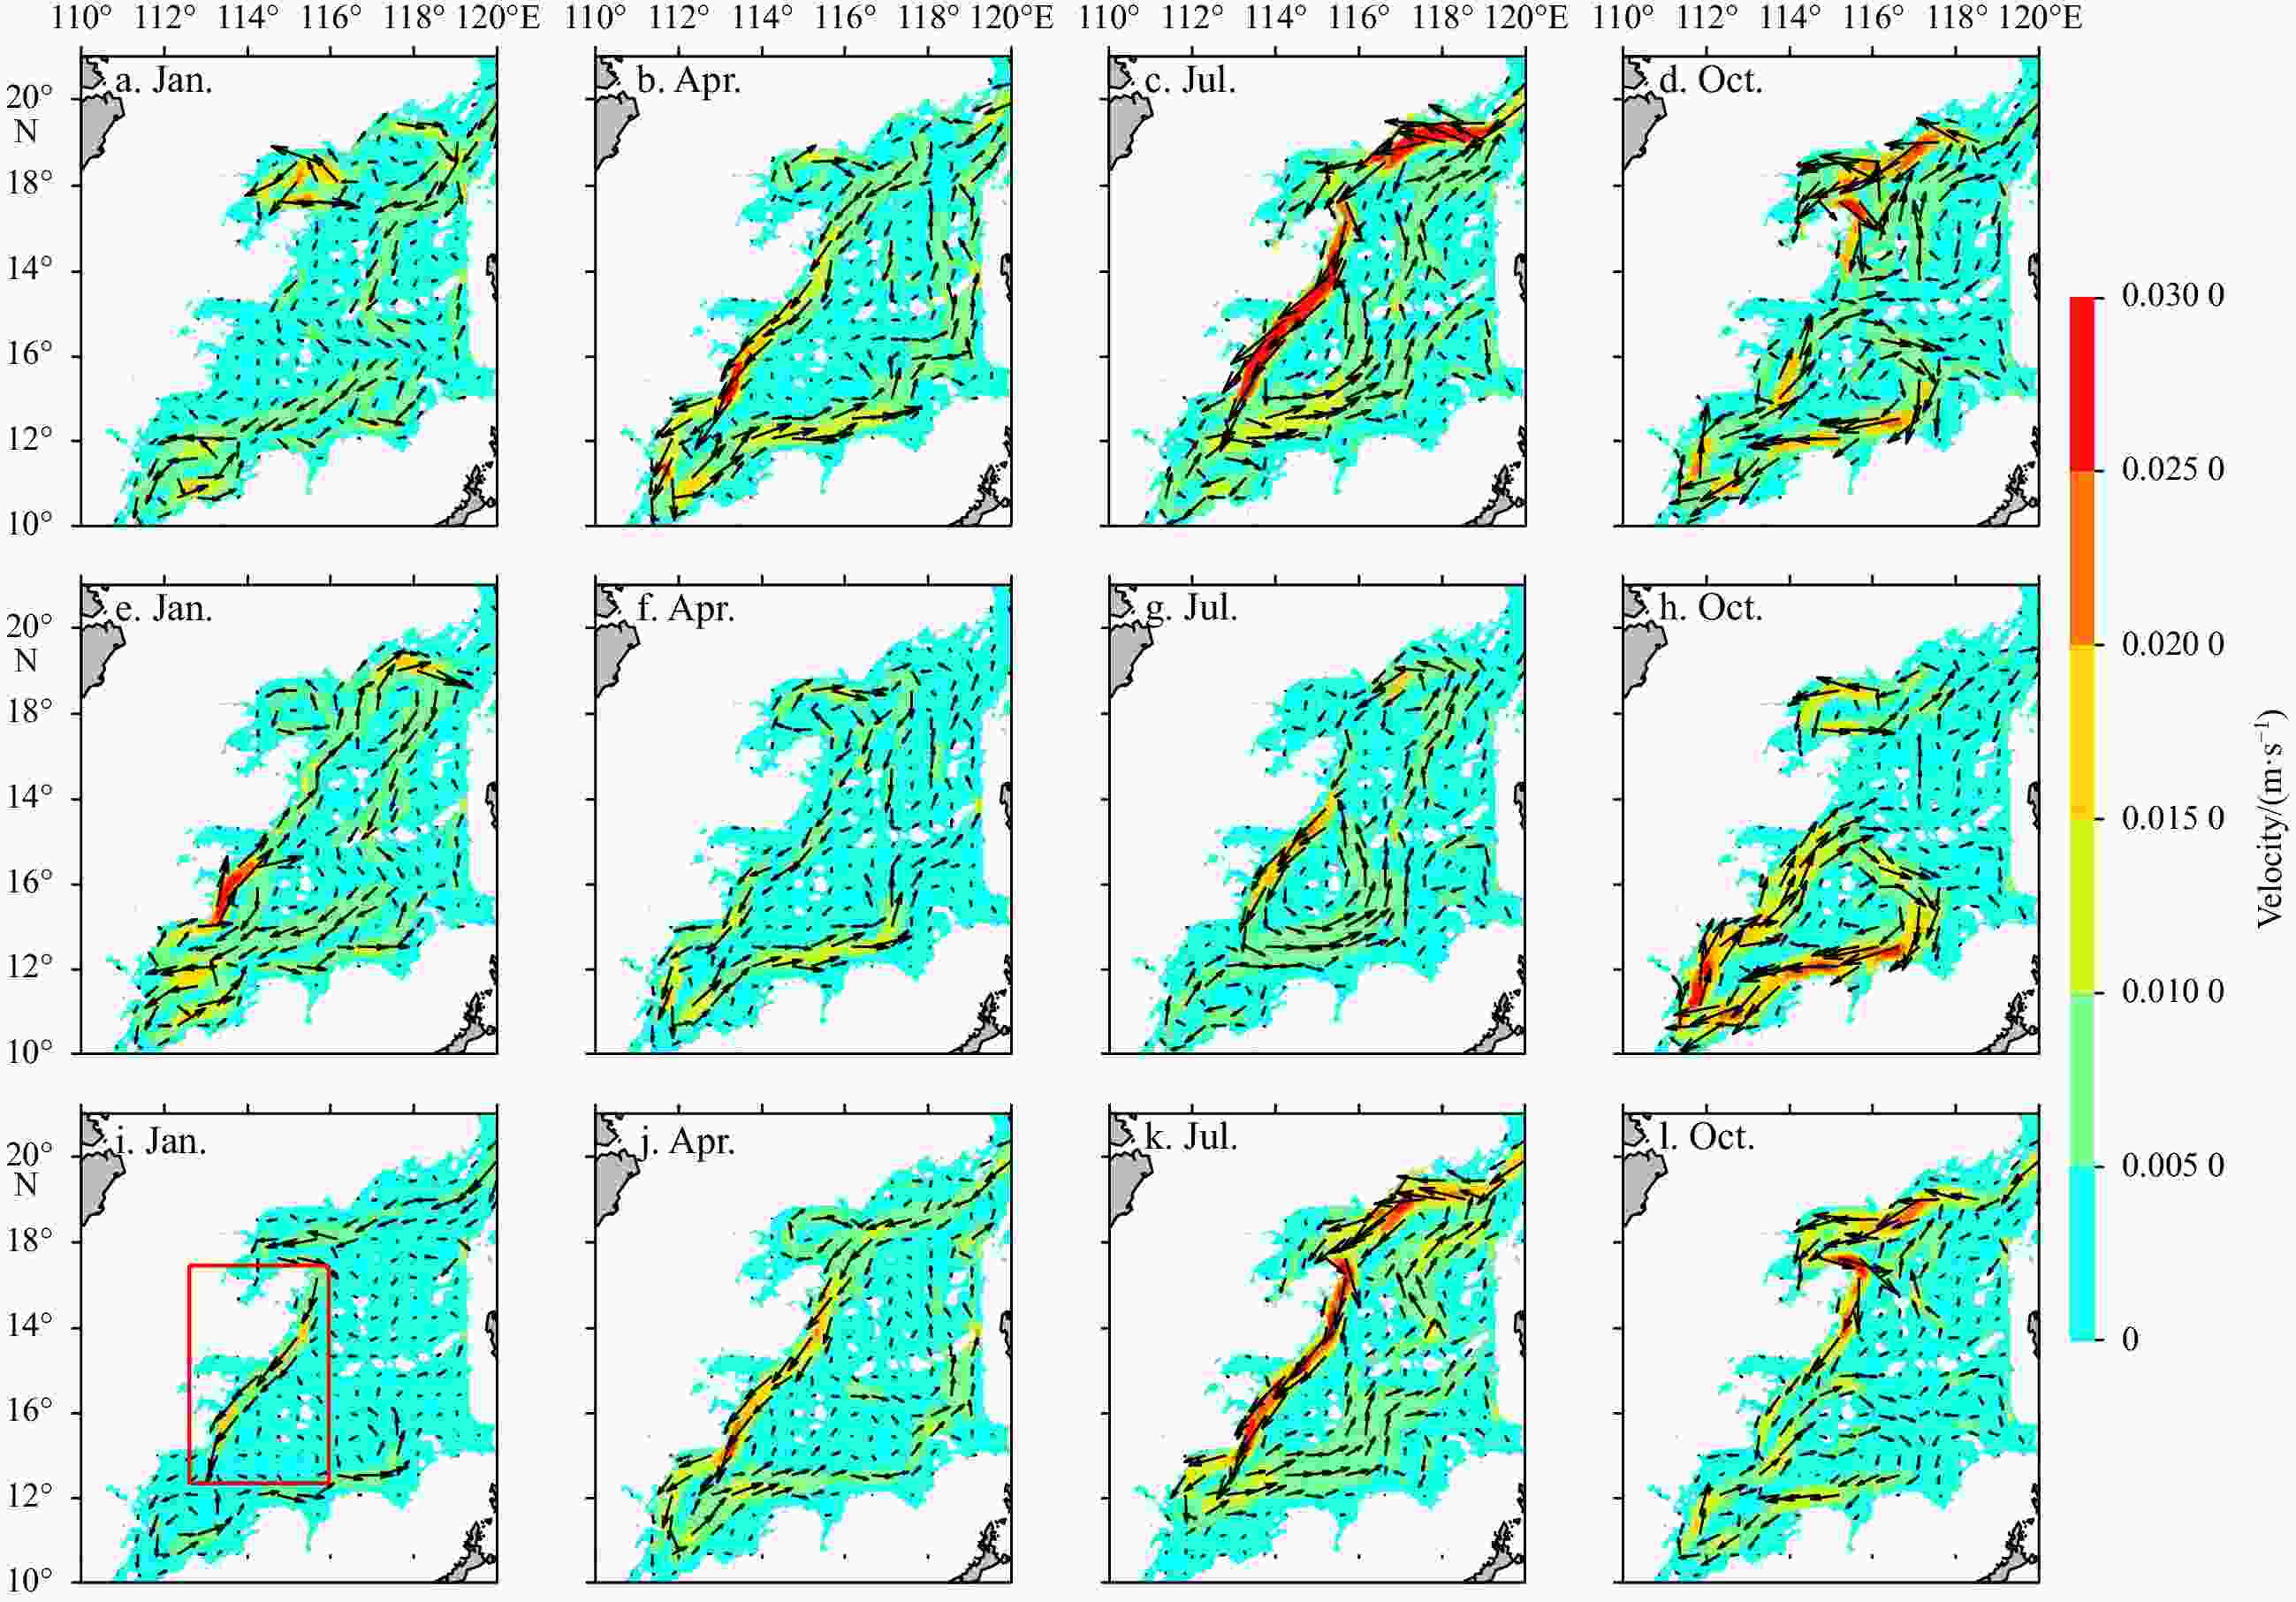
Figure 3. The NHYCOM_produced monthly mean SCS deep circulation (vertically averaged downward from 2 000 m depth) in January, April, July and October for the control experiment (a–d), for the topography modified experiment (e–h), and for the wind sensitivity experiment (i–l). The red box in i indicates the western boundary, where compared with the control experiment, the deep circulation shows an obvious change. The current arrows are plotted approximately 4 every 2 degrees and are smoothed by averaging 81_grids around the central arrow.

Figure 4. The NHYCOM produced annual mean SCS deep circulation (vertically averaged downward from 2 000 m depth). The current arrows are plotted approximately 4 every 2 degrees and are smoothed by averaging 81_grids around the central arrow. The two blue sections represent the western boundary section used to calculate the deep western boundary current transport in Section 5.2.
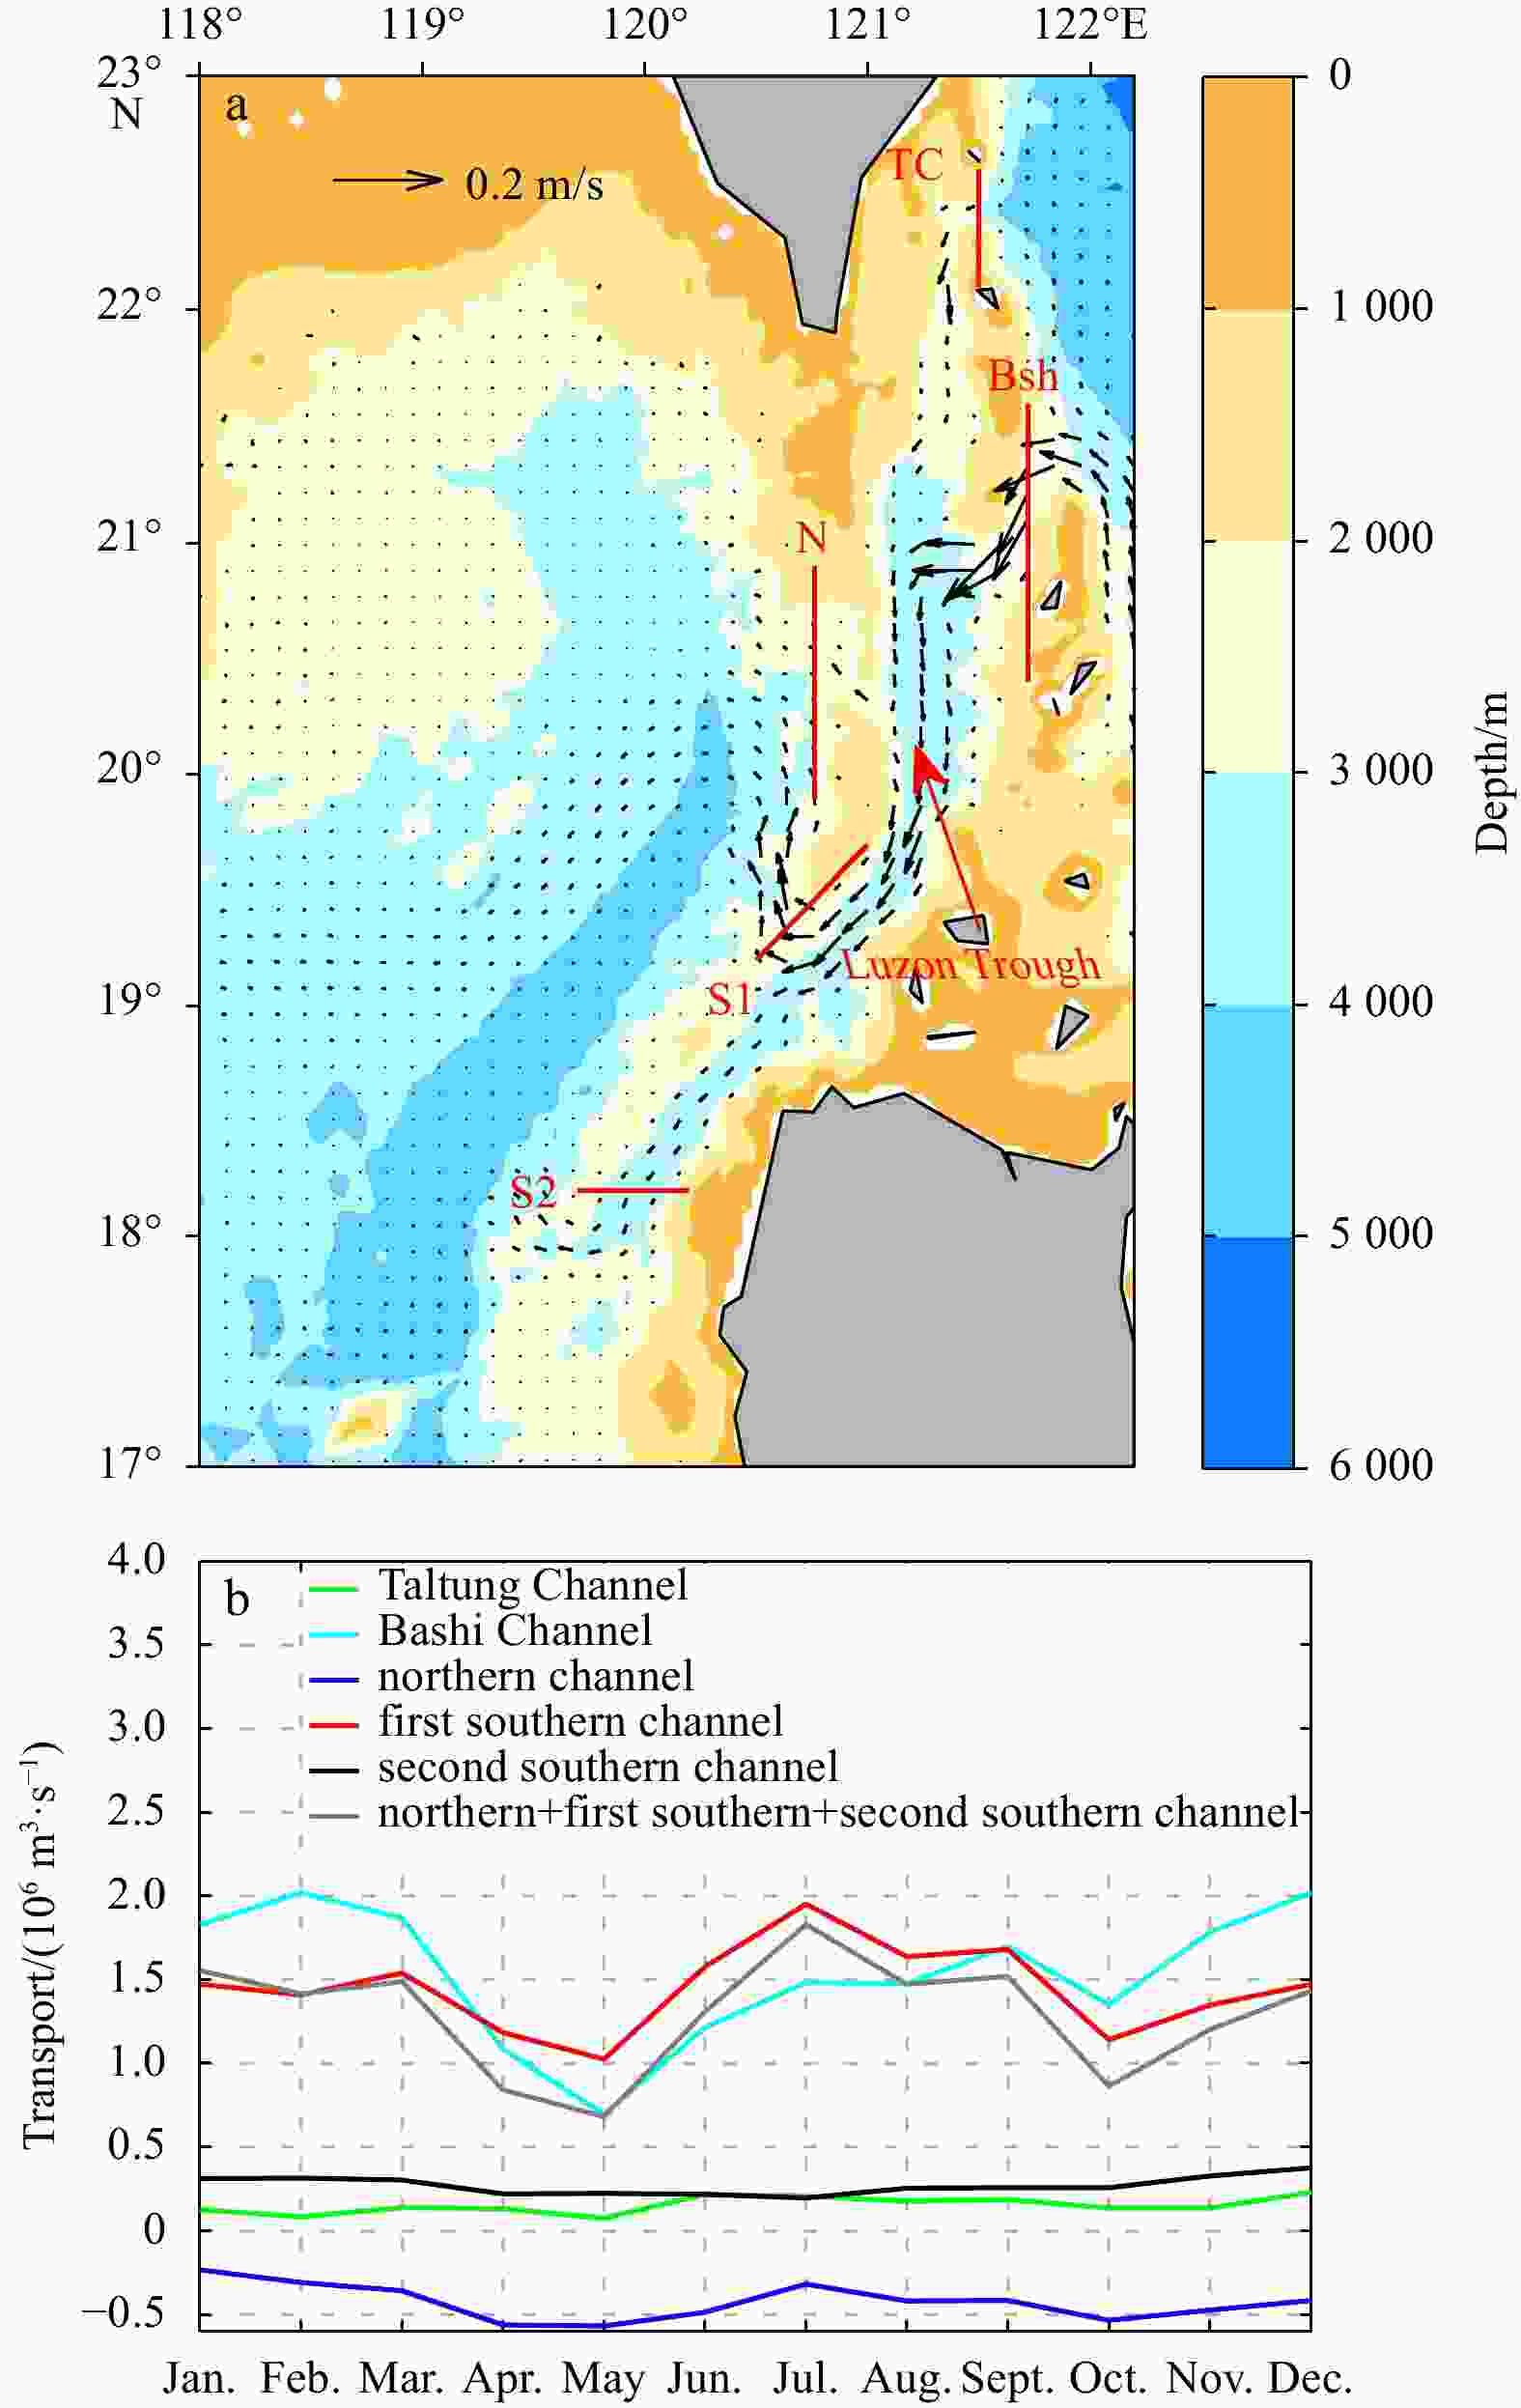
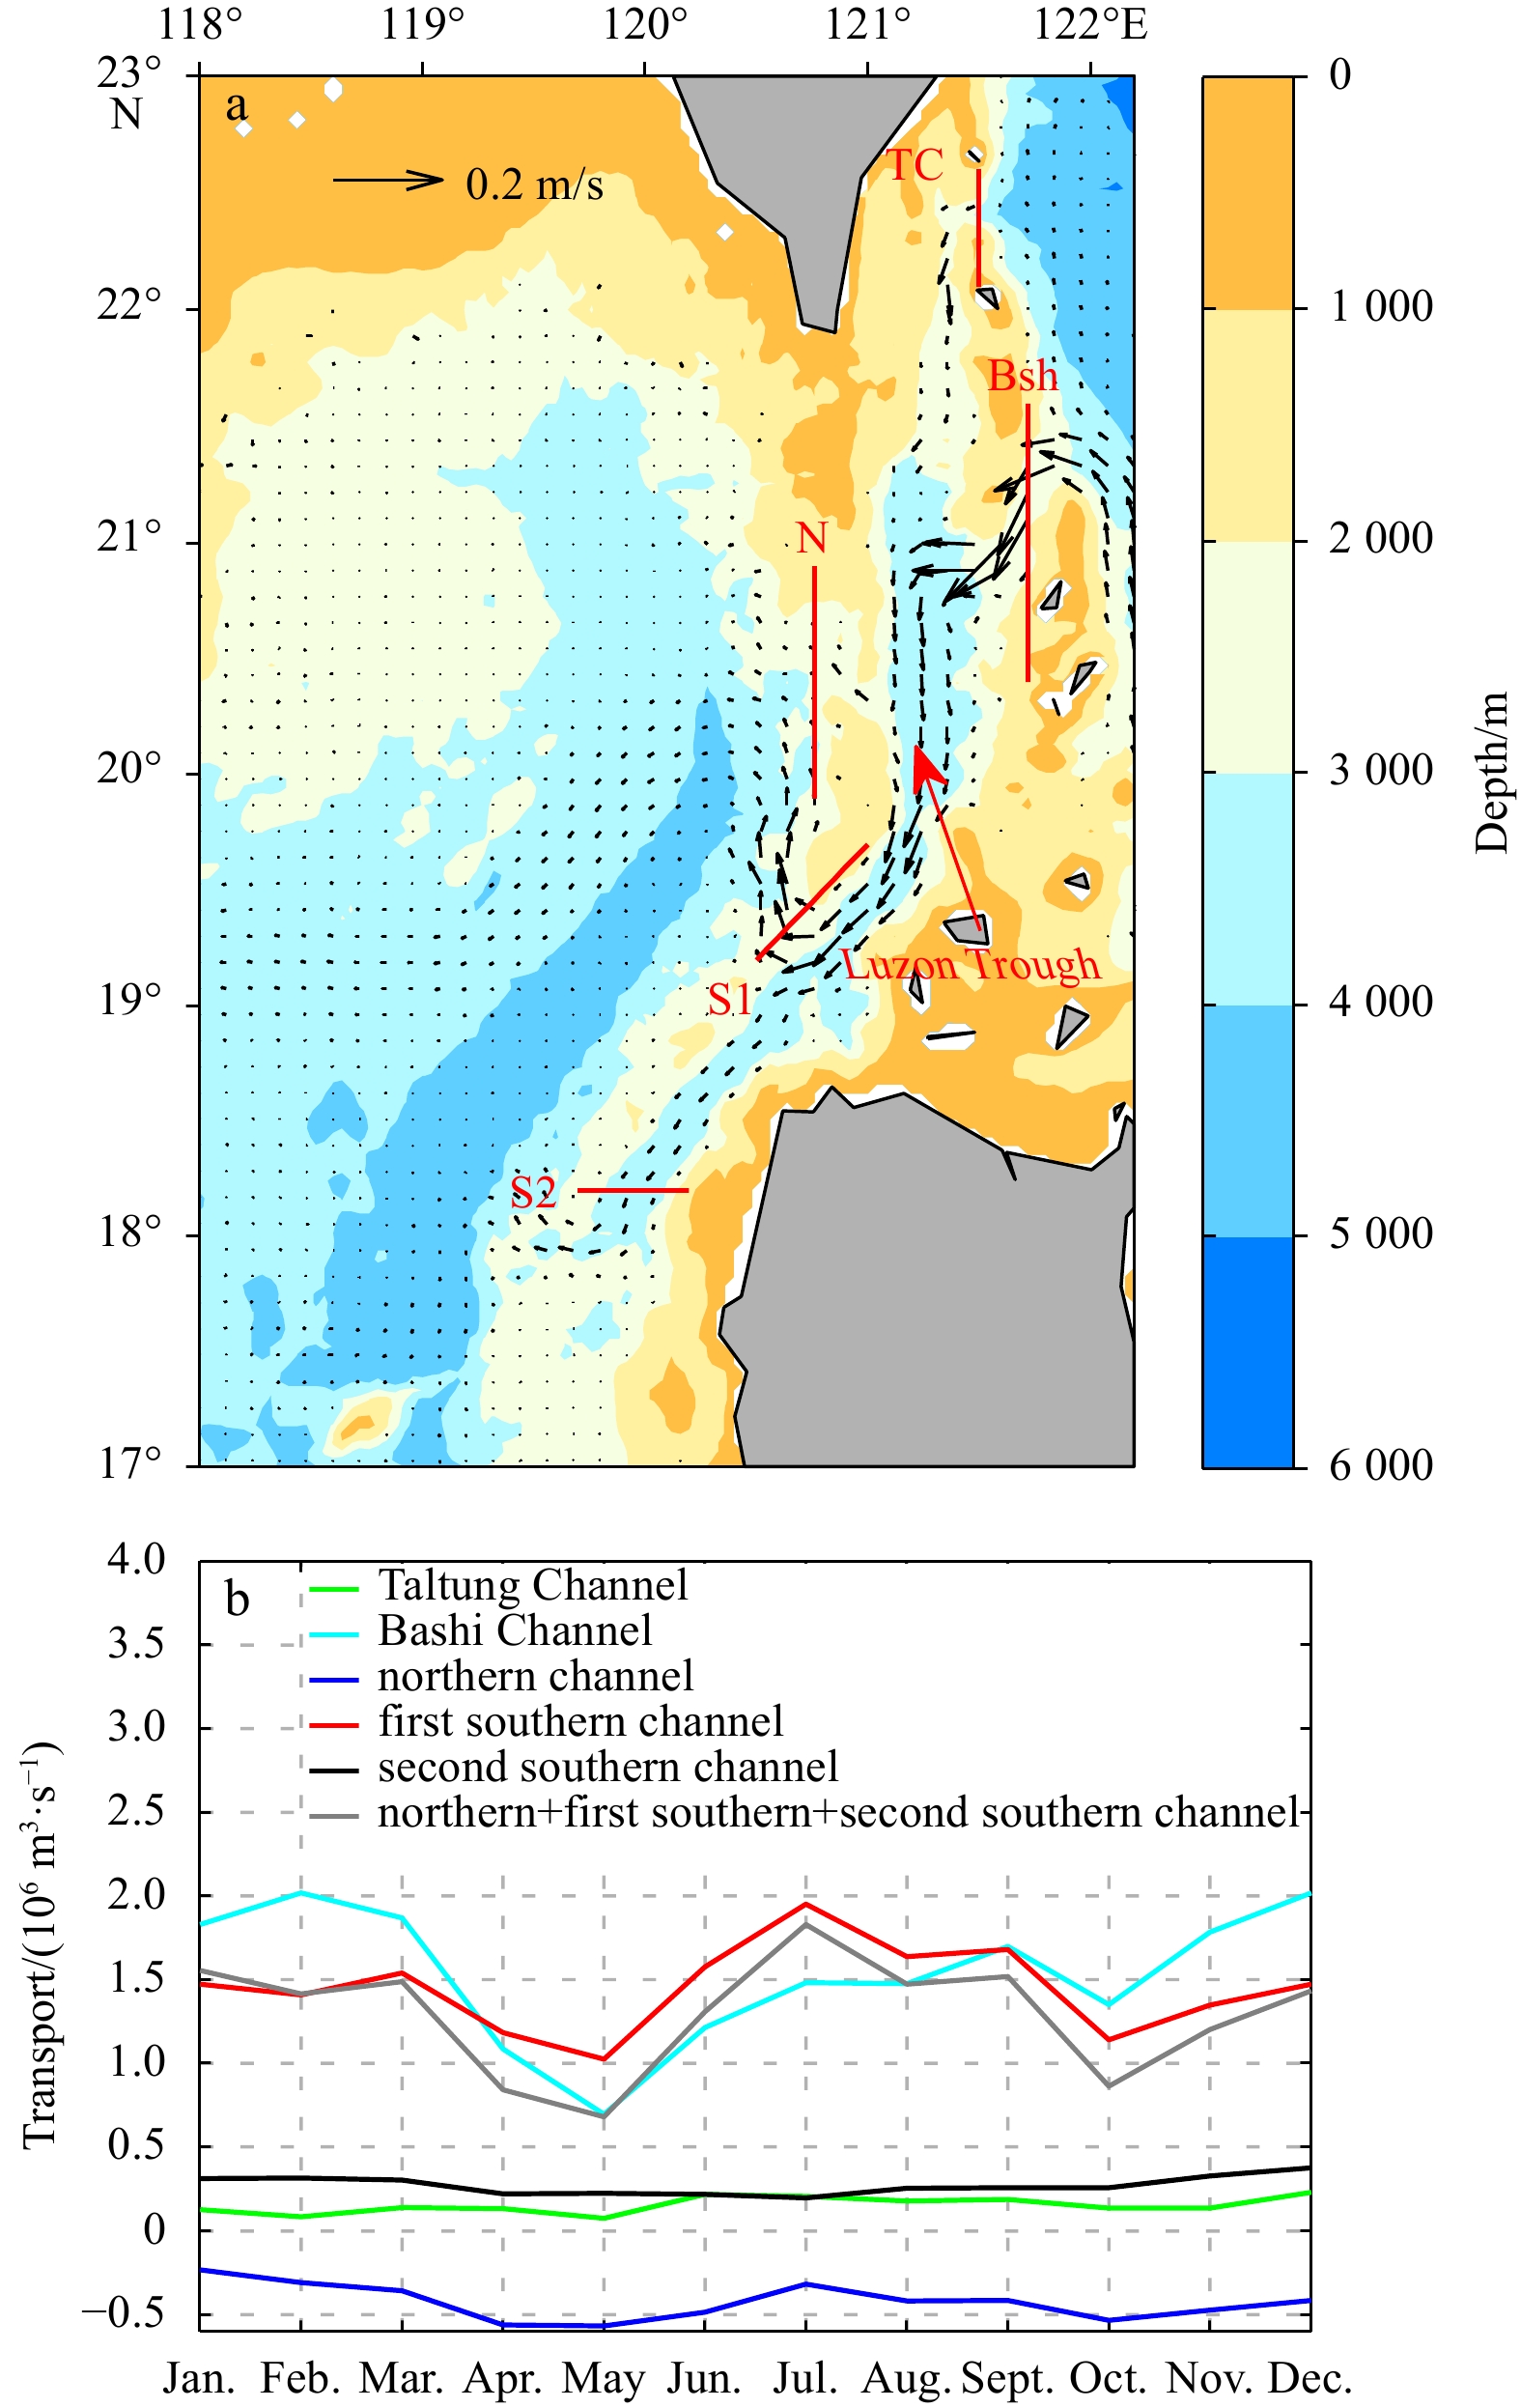
Figure 5. The NHYCOM-produced annual mean Luzon Strait deep circulation (vertically averaged downward from 2 000 m depth) (a) and the NHYCOM-produced monthly mean transport of each channel of the deep Luzon Strait below 2 000 m depth (a positive value represents the water flowing into the SCS deep basin) (b). In a, capital “TC” indicates Taltung Channel, capital “Bsh” indicates the Bashi Channel, capital “N” indicates the northern channel in the western ridge, capital “S1” indicates the first southern channel in the western ridge, and capital “S2” indicates the second southern channel in the western ridge; in b, green line indicates the Taltung Channel transport, sky blue line indicates the Bashi Channel transport, blue line indicates the northern channel in the western ridge transport, red line indicates the first southern channel in the western ridge transport, balck line indicates the second southern channel in the western ridge transport, and gray line indicates the total transport of the northern and first southern channels and second southern channels in the western ridge.
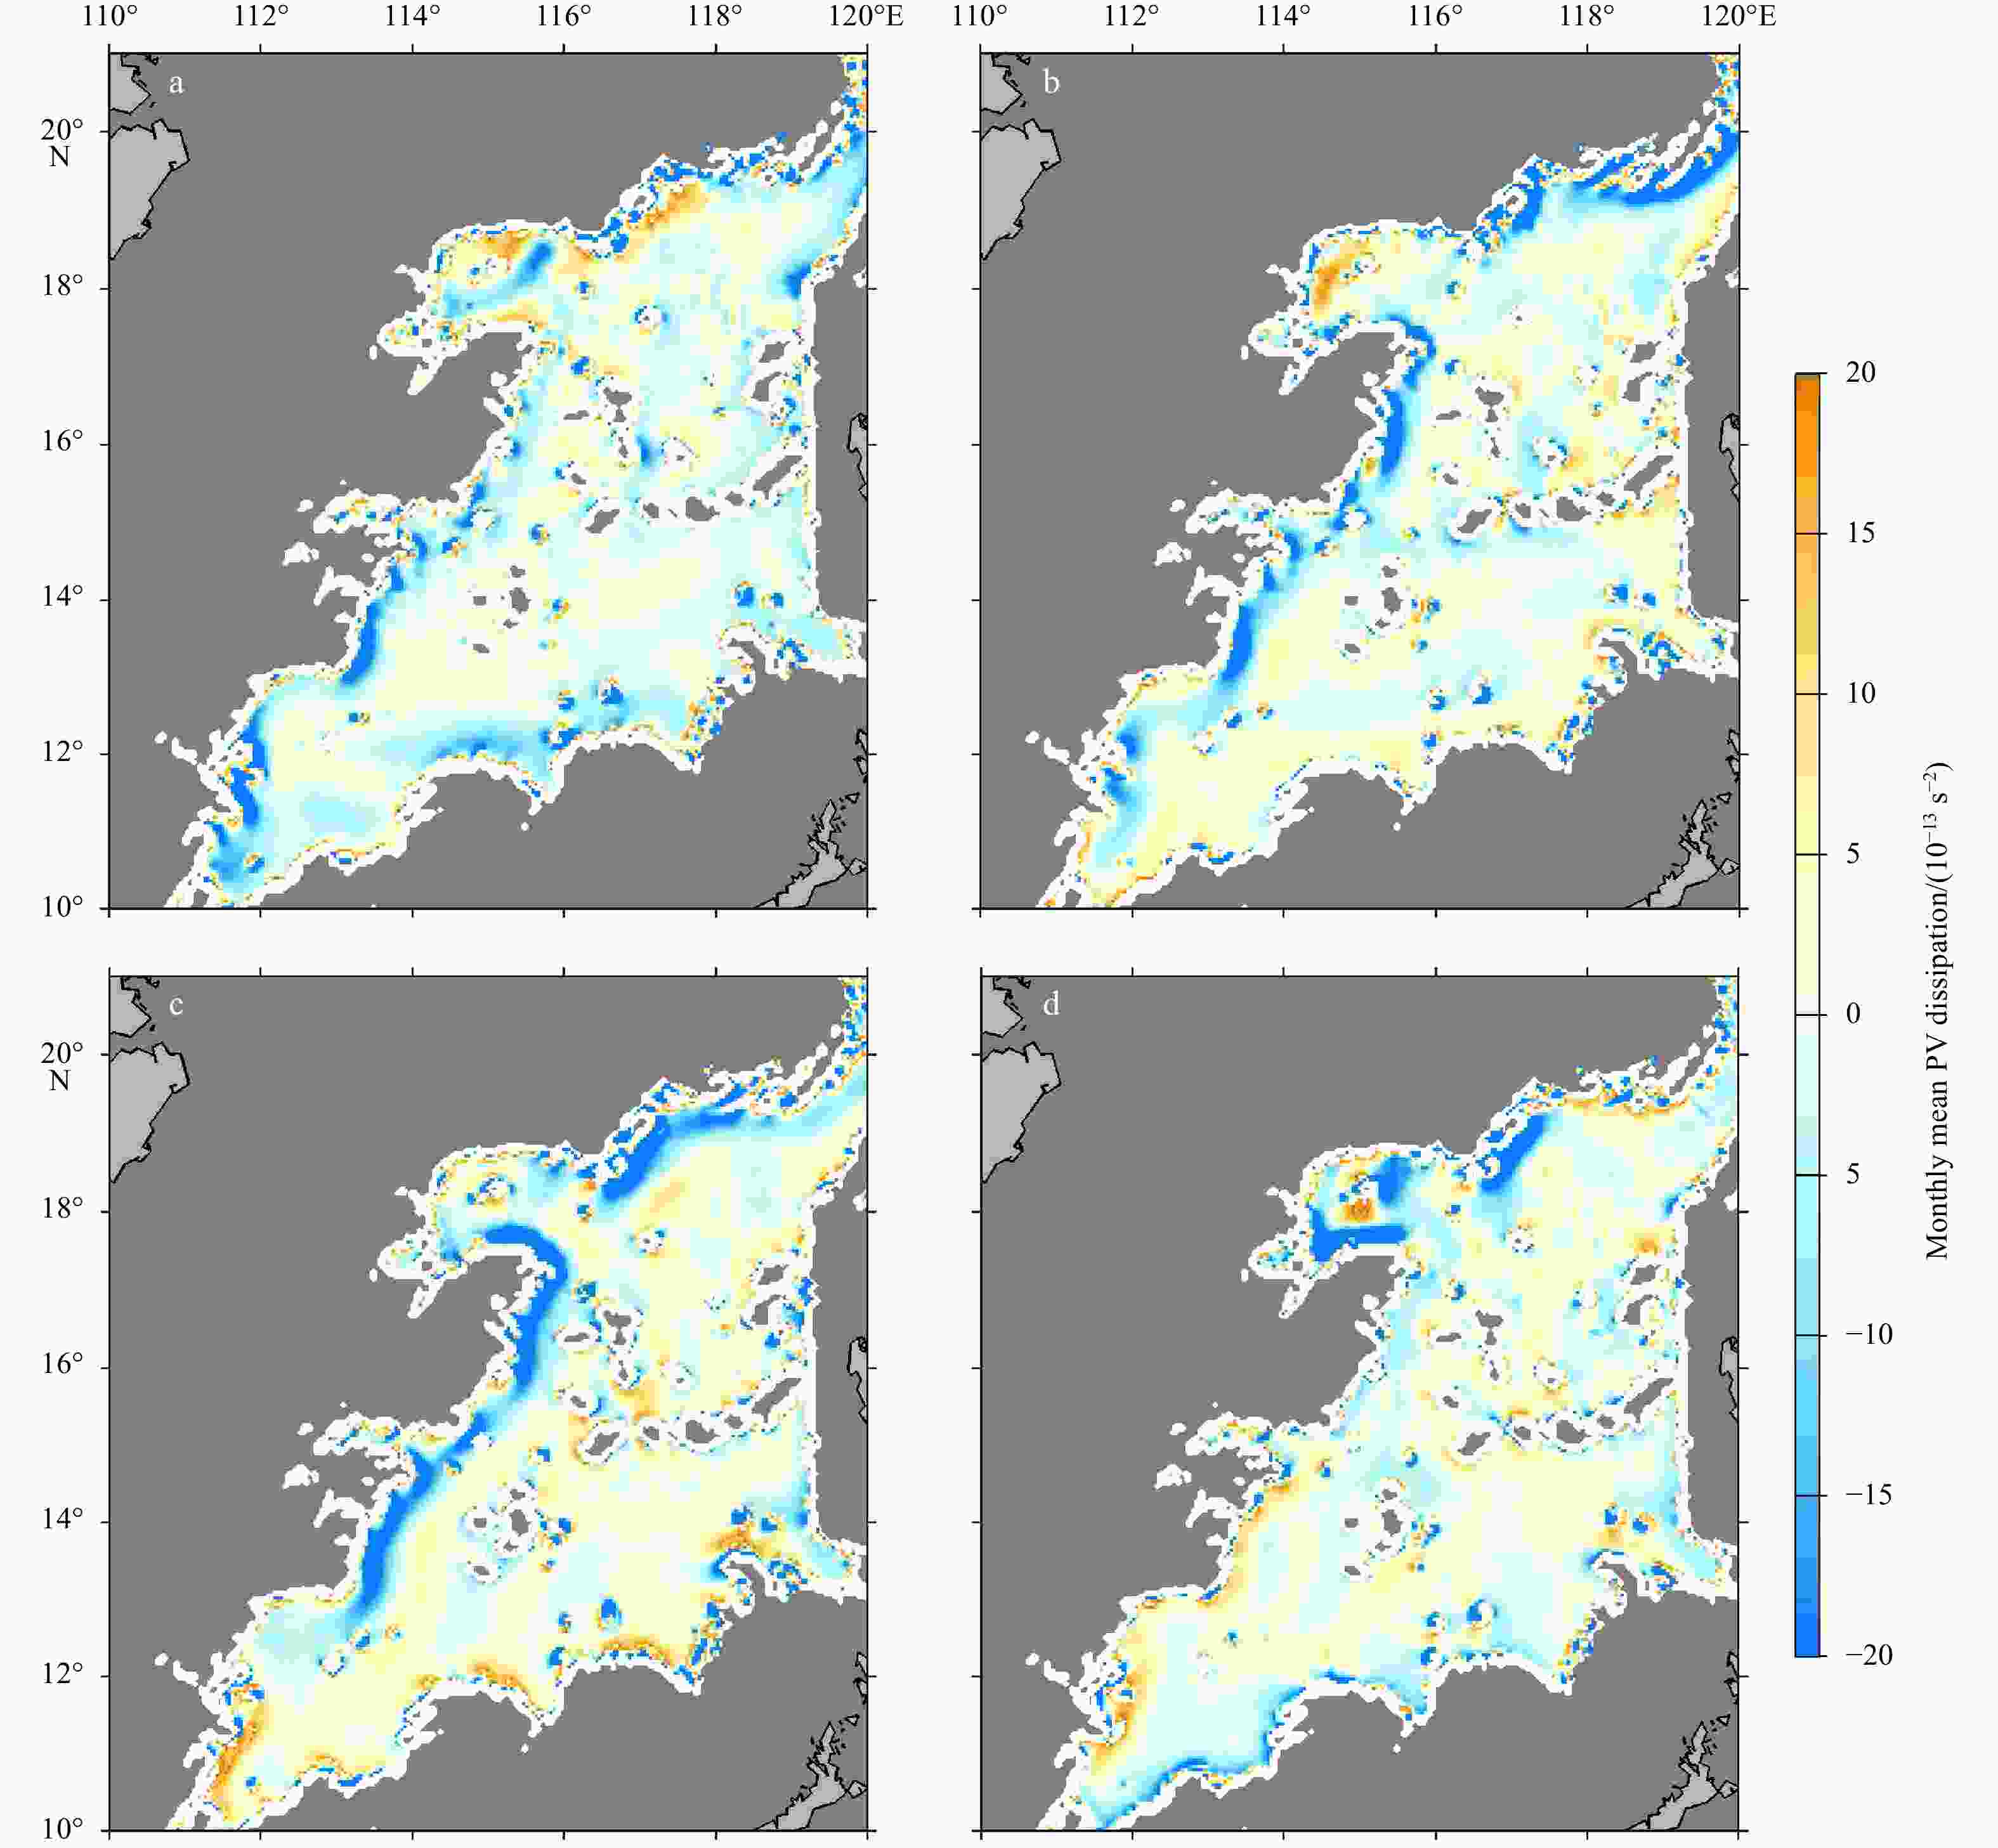
Figure 6. The NHYCOM-produced spatial distribution of monthly mean PV dissipation in the SCS deep basin in January (a), April (b), July (c) and October (d).
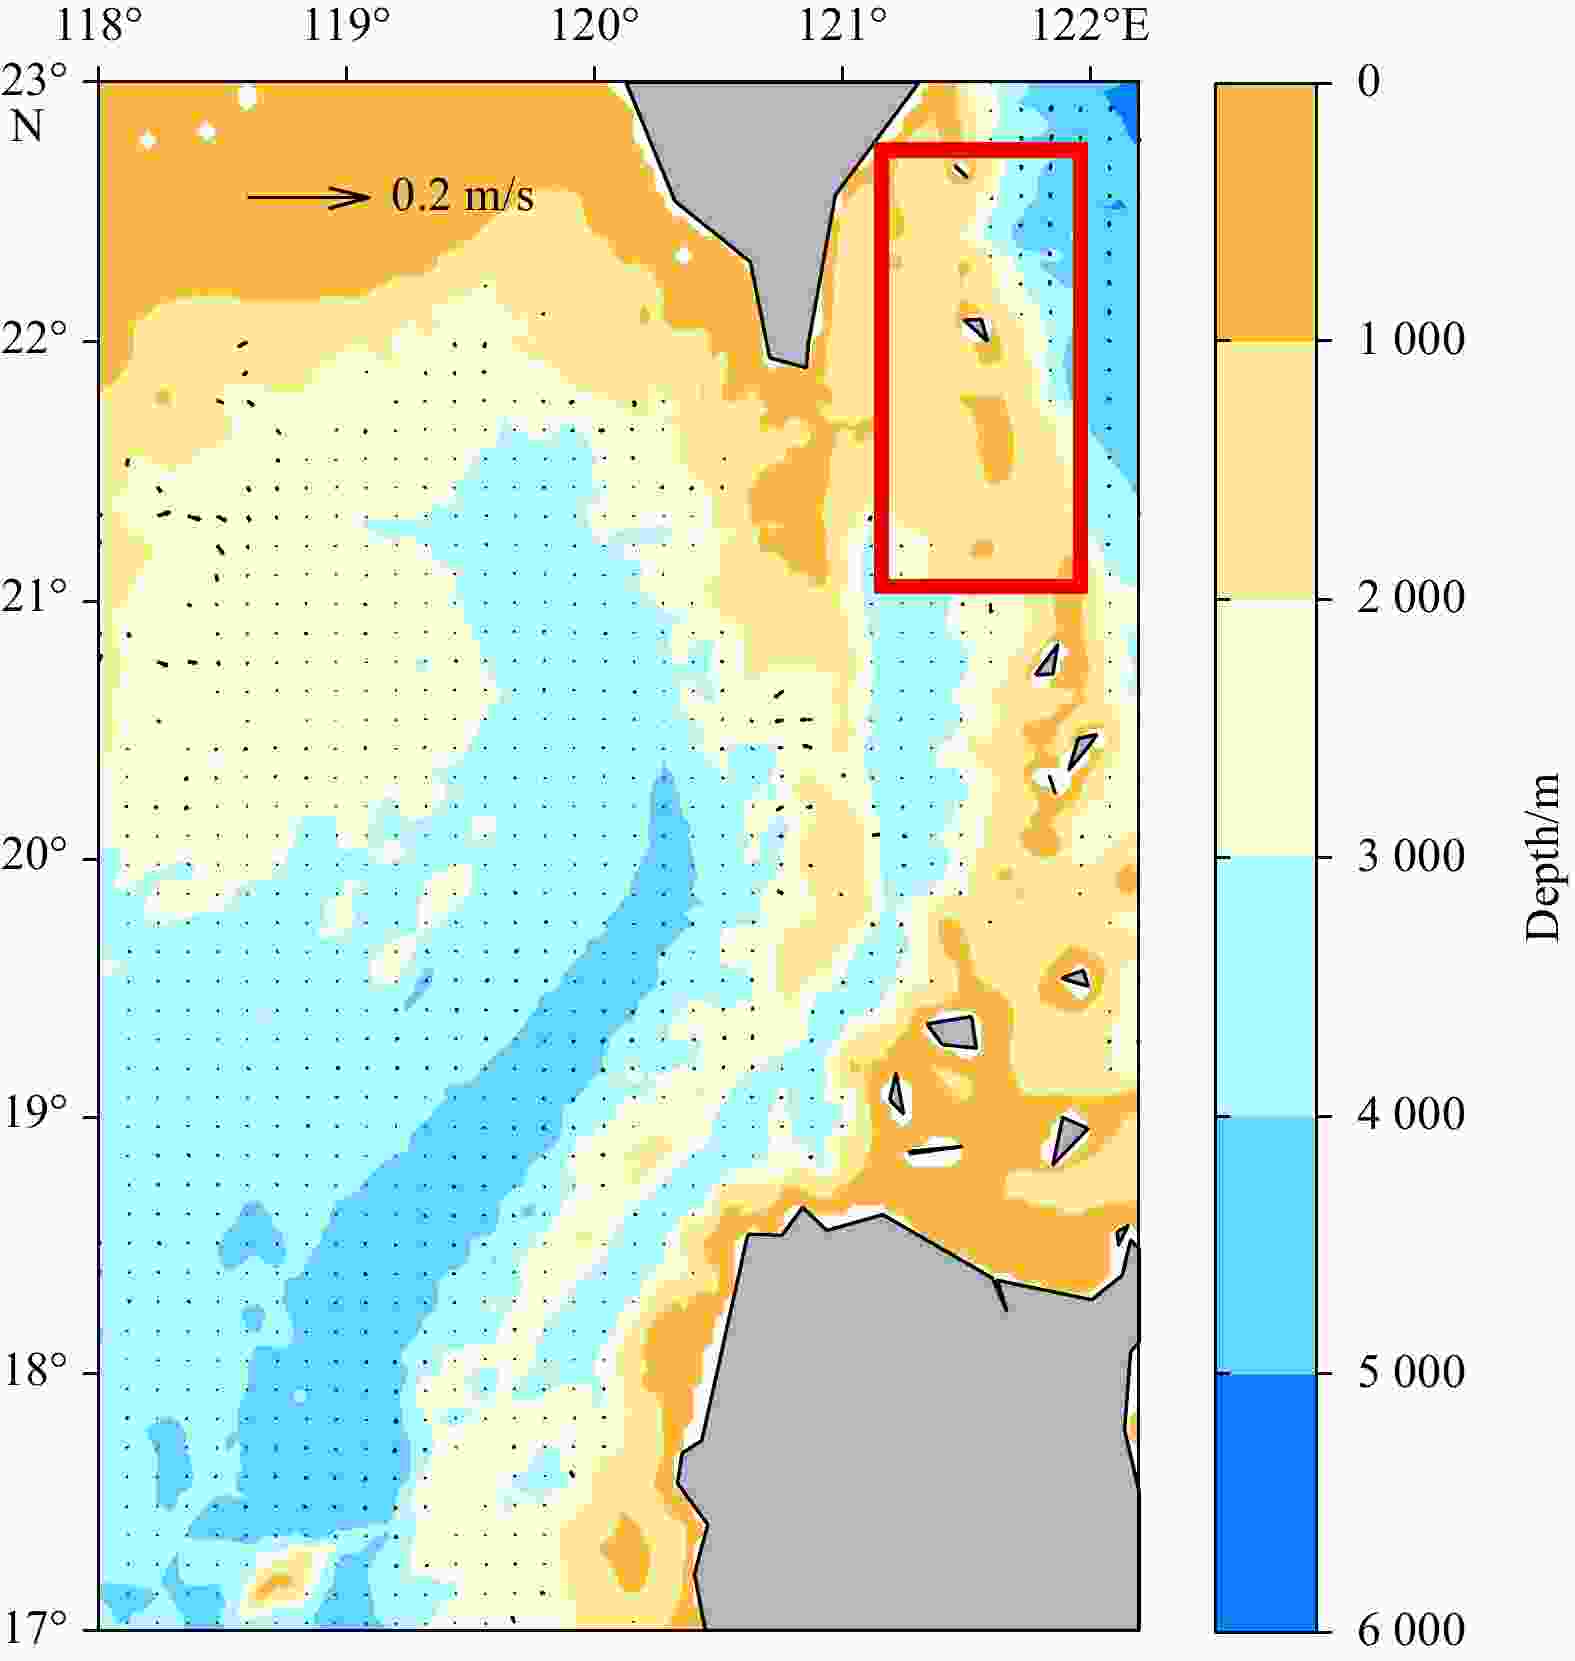
Figure 7. The NHYCOM_produced Luzon Strait deep circulation in the topography modified experiment. In the red box, the channel at greater than 1500 m depth in the eastern ridge of the Luzon Strait is closed.
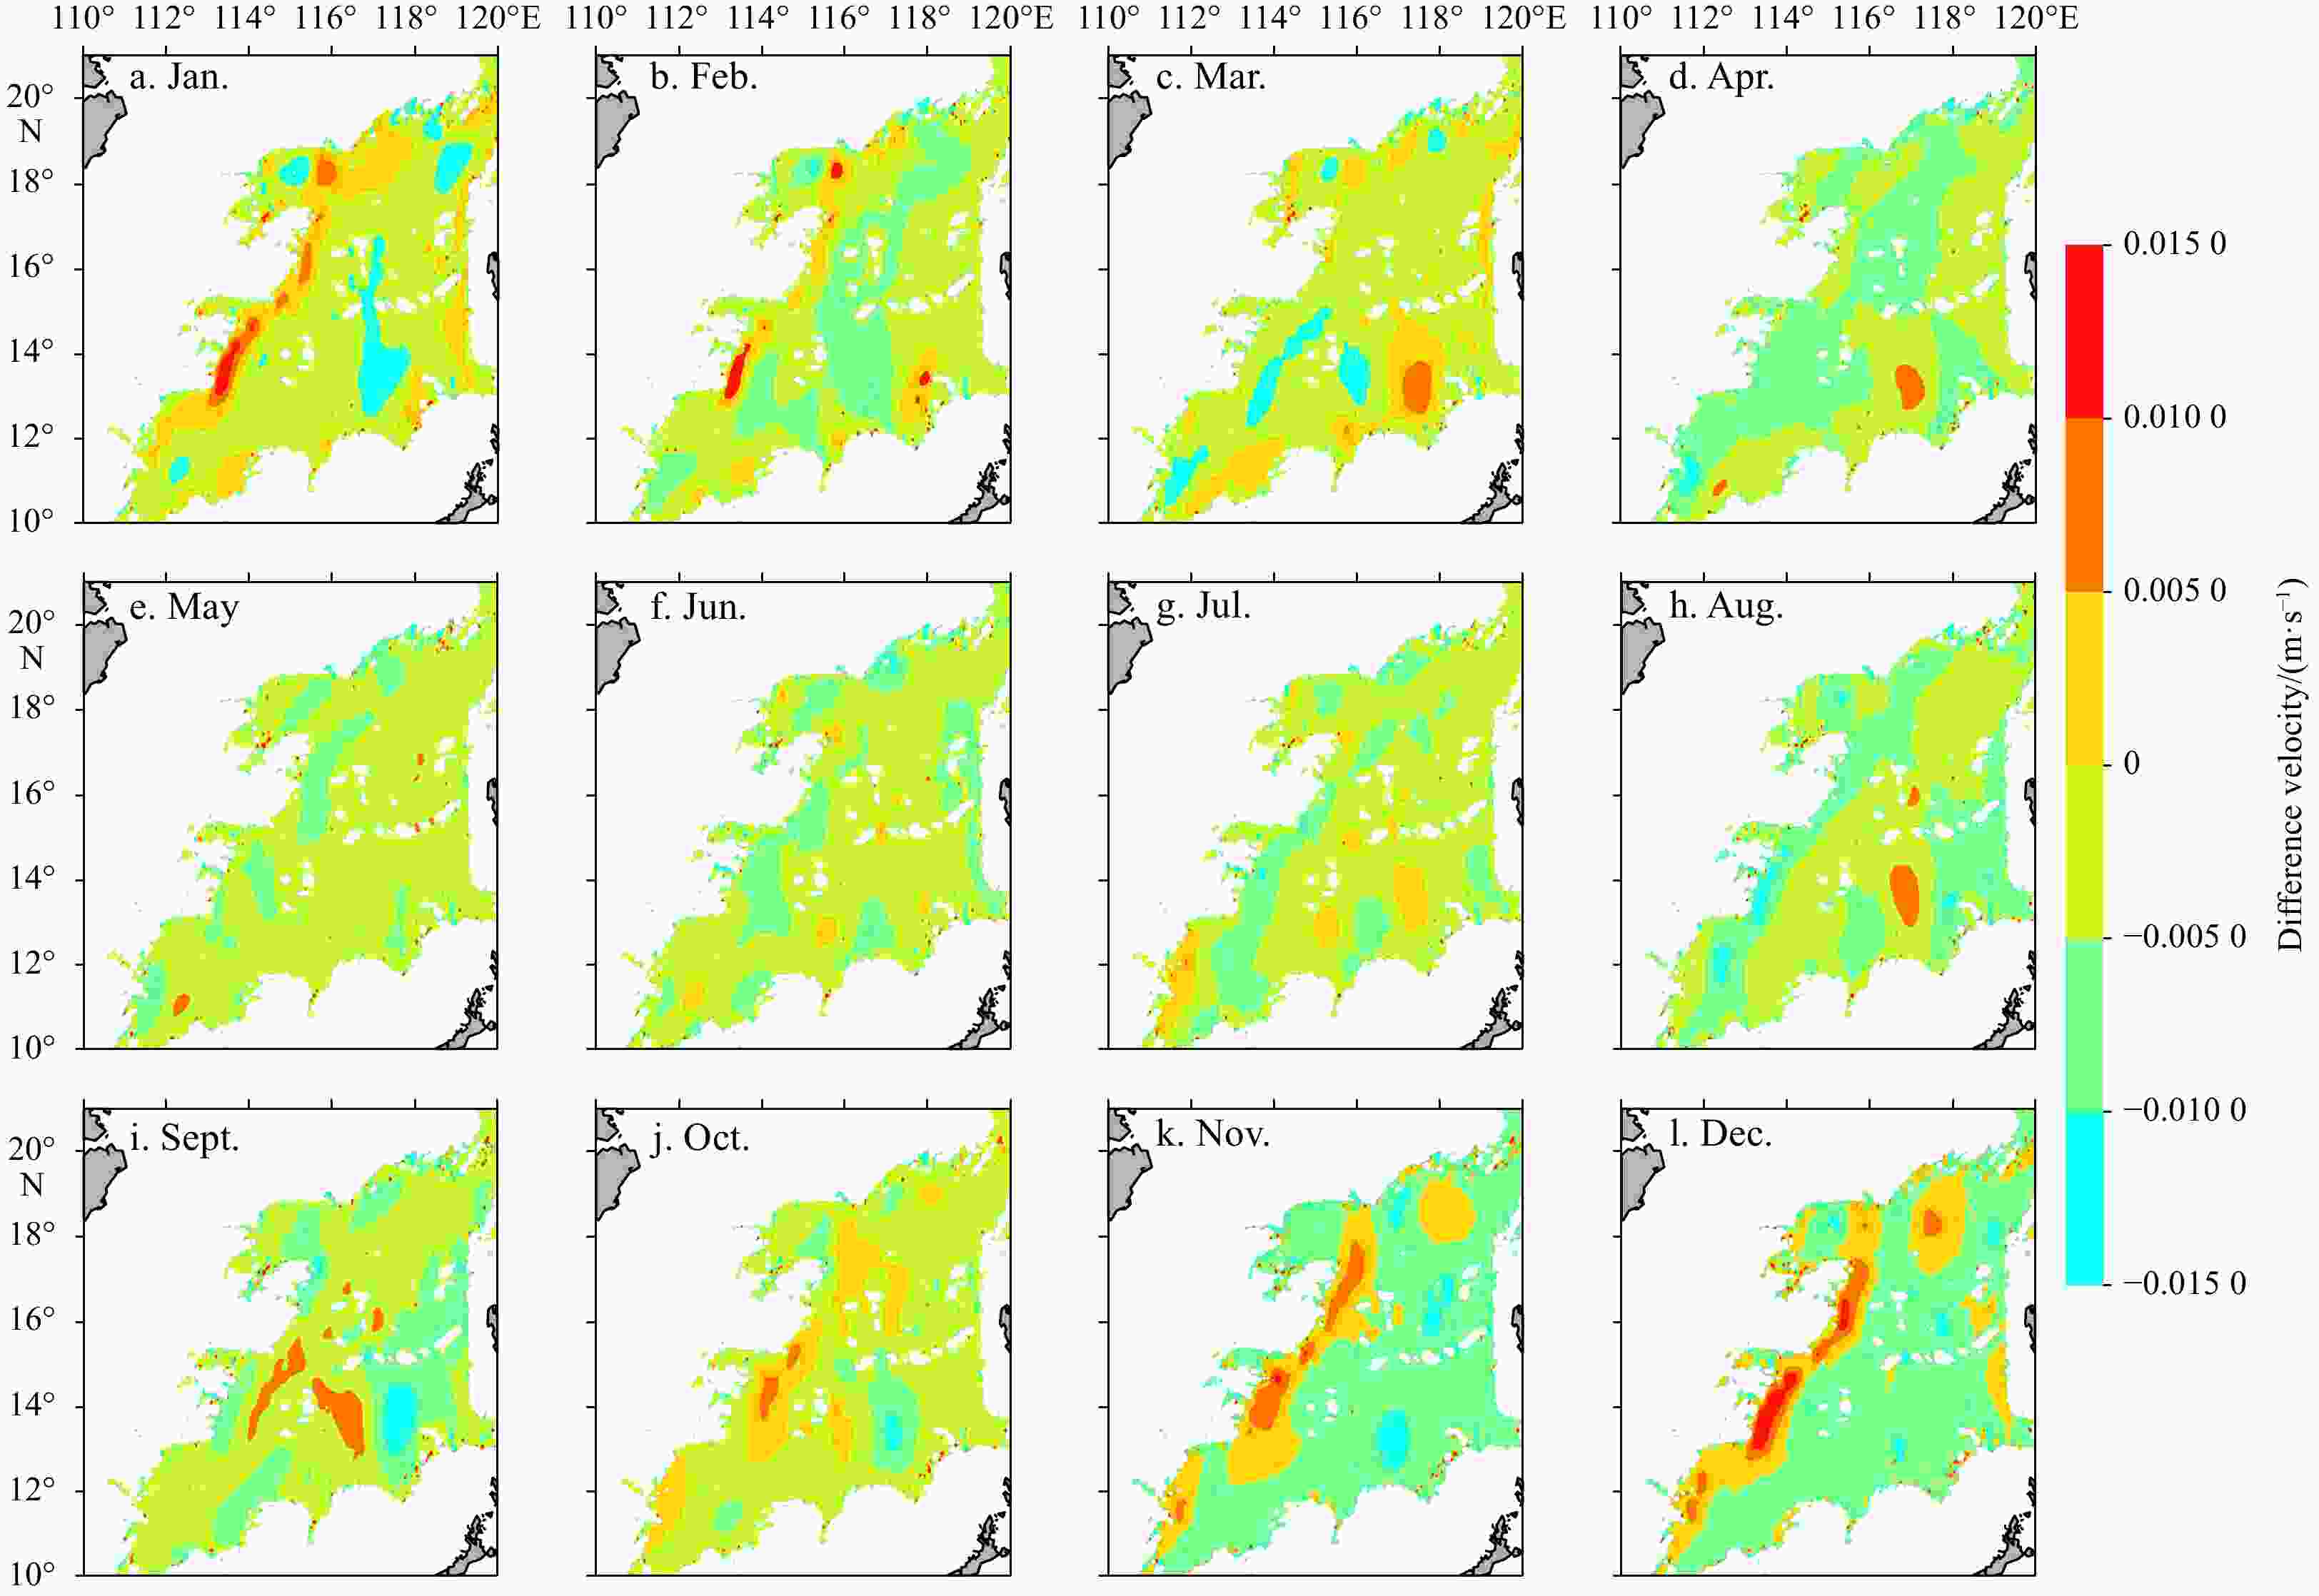
Figure 8. The difference in monthly mean meridional velocity between the control experiment and the wind sensitivity experiment (control-sensitivity, at a depth of 3 000 m).
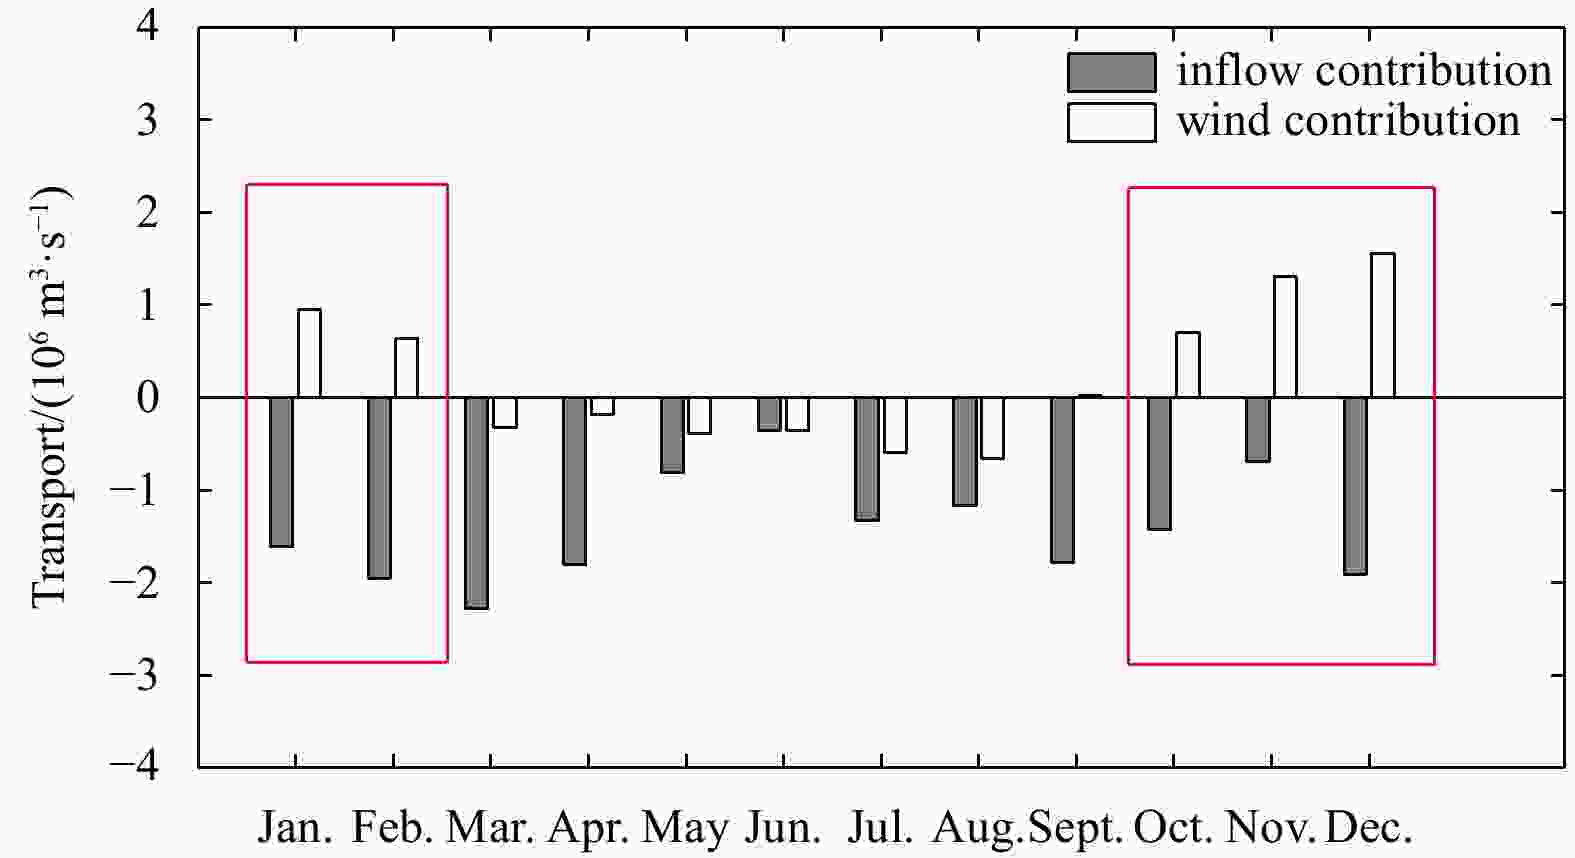
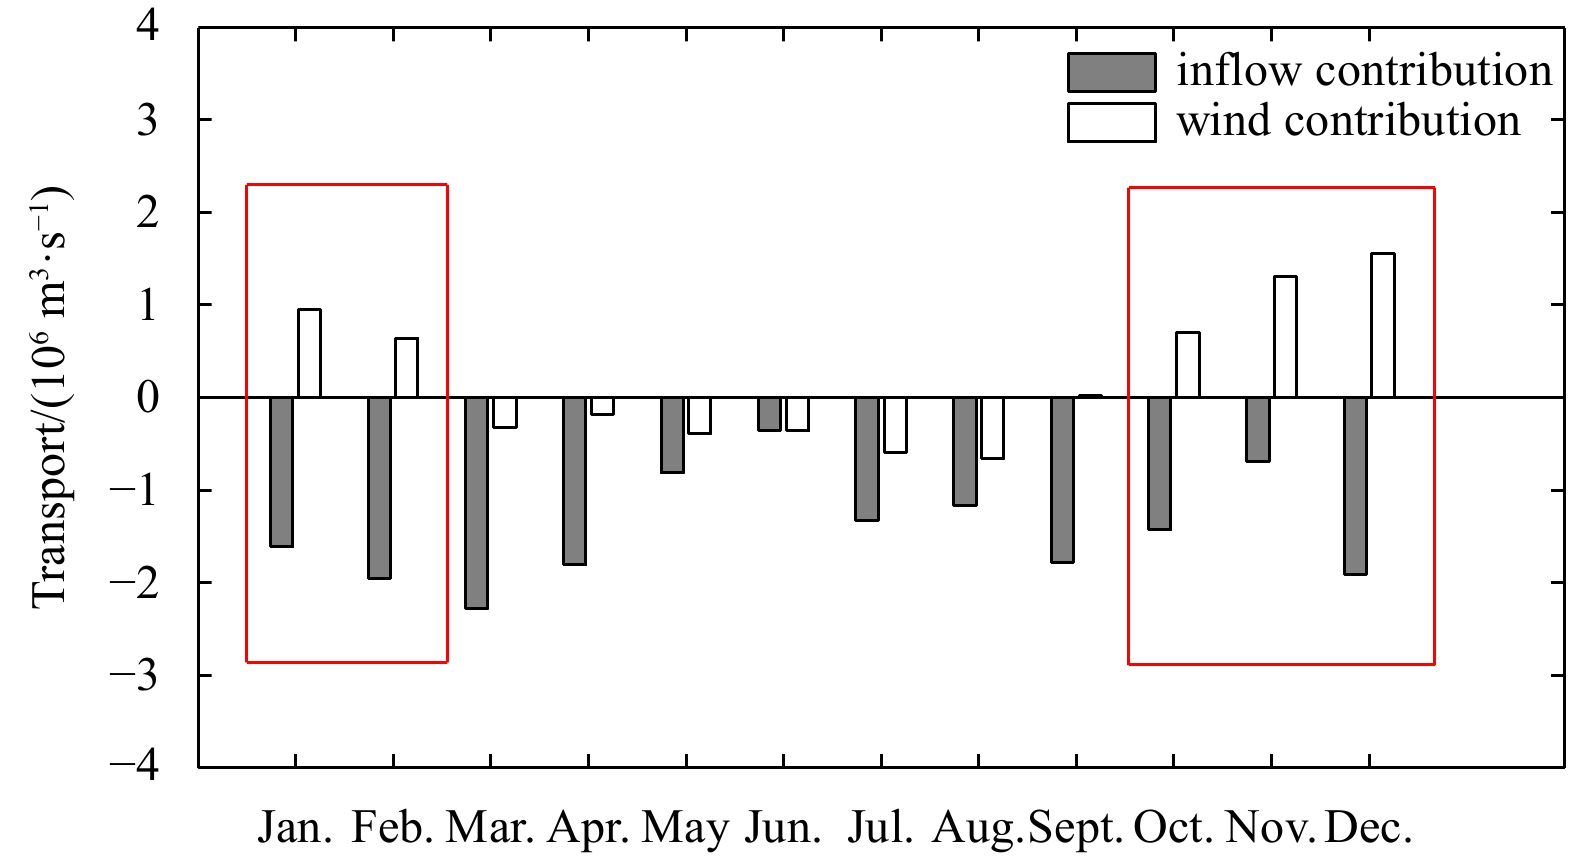
Figure 9. The SCS deep western boundary circulation transport (below 2 000 m depth) was contributed by the Luzon Strait deep overflow (gray bar) and by the SCS surface wind (white bar). The positive value represents northward transport, and the negative value represents southward transport.
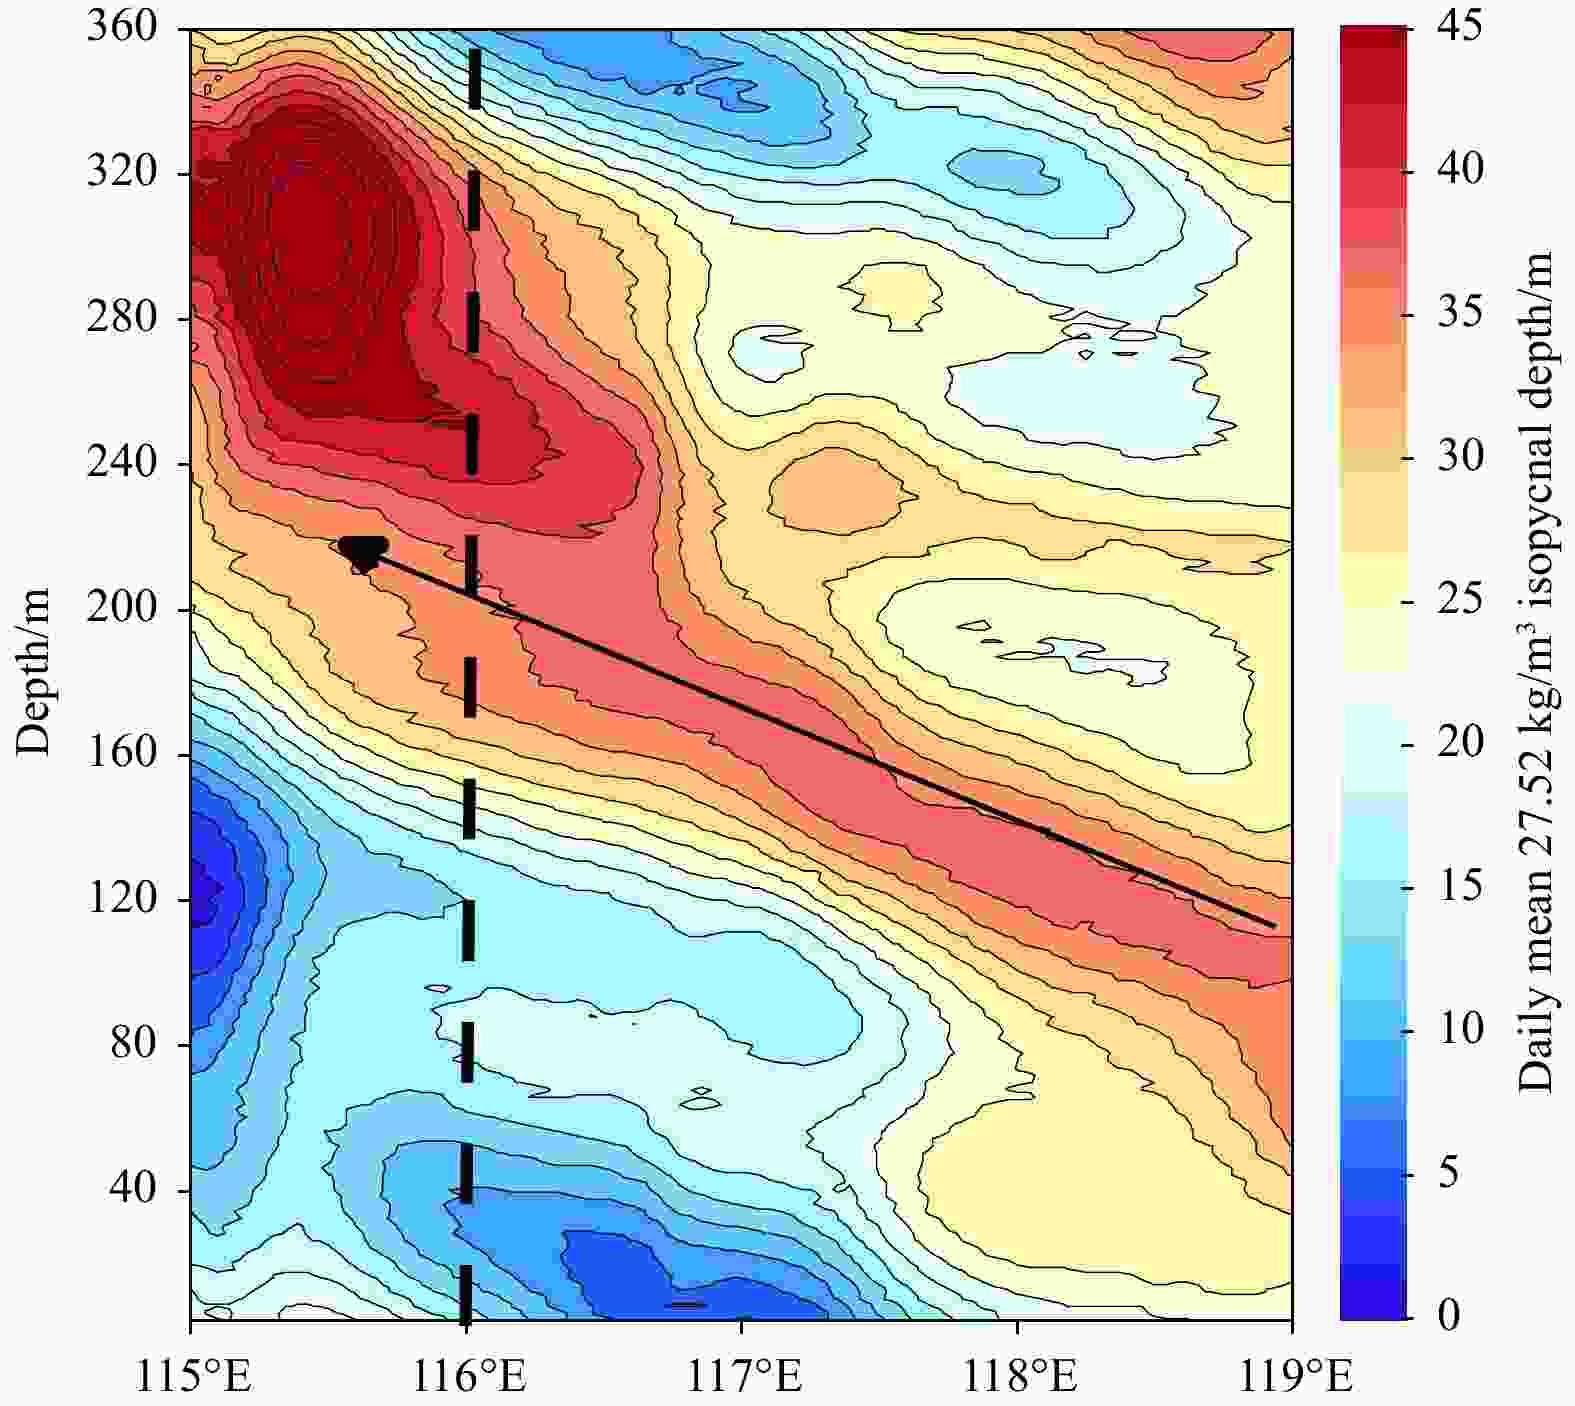
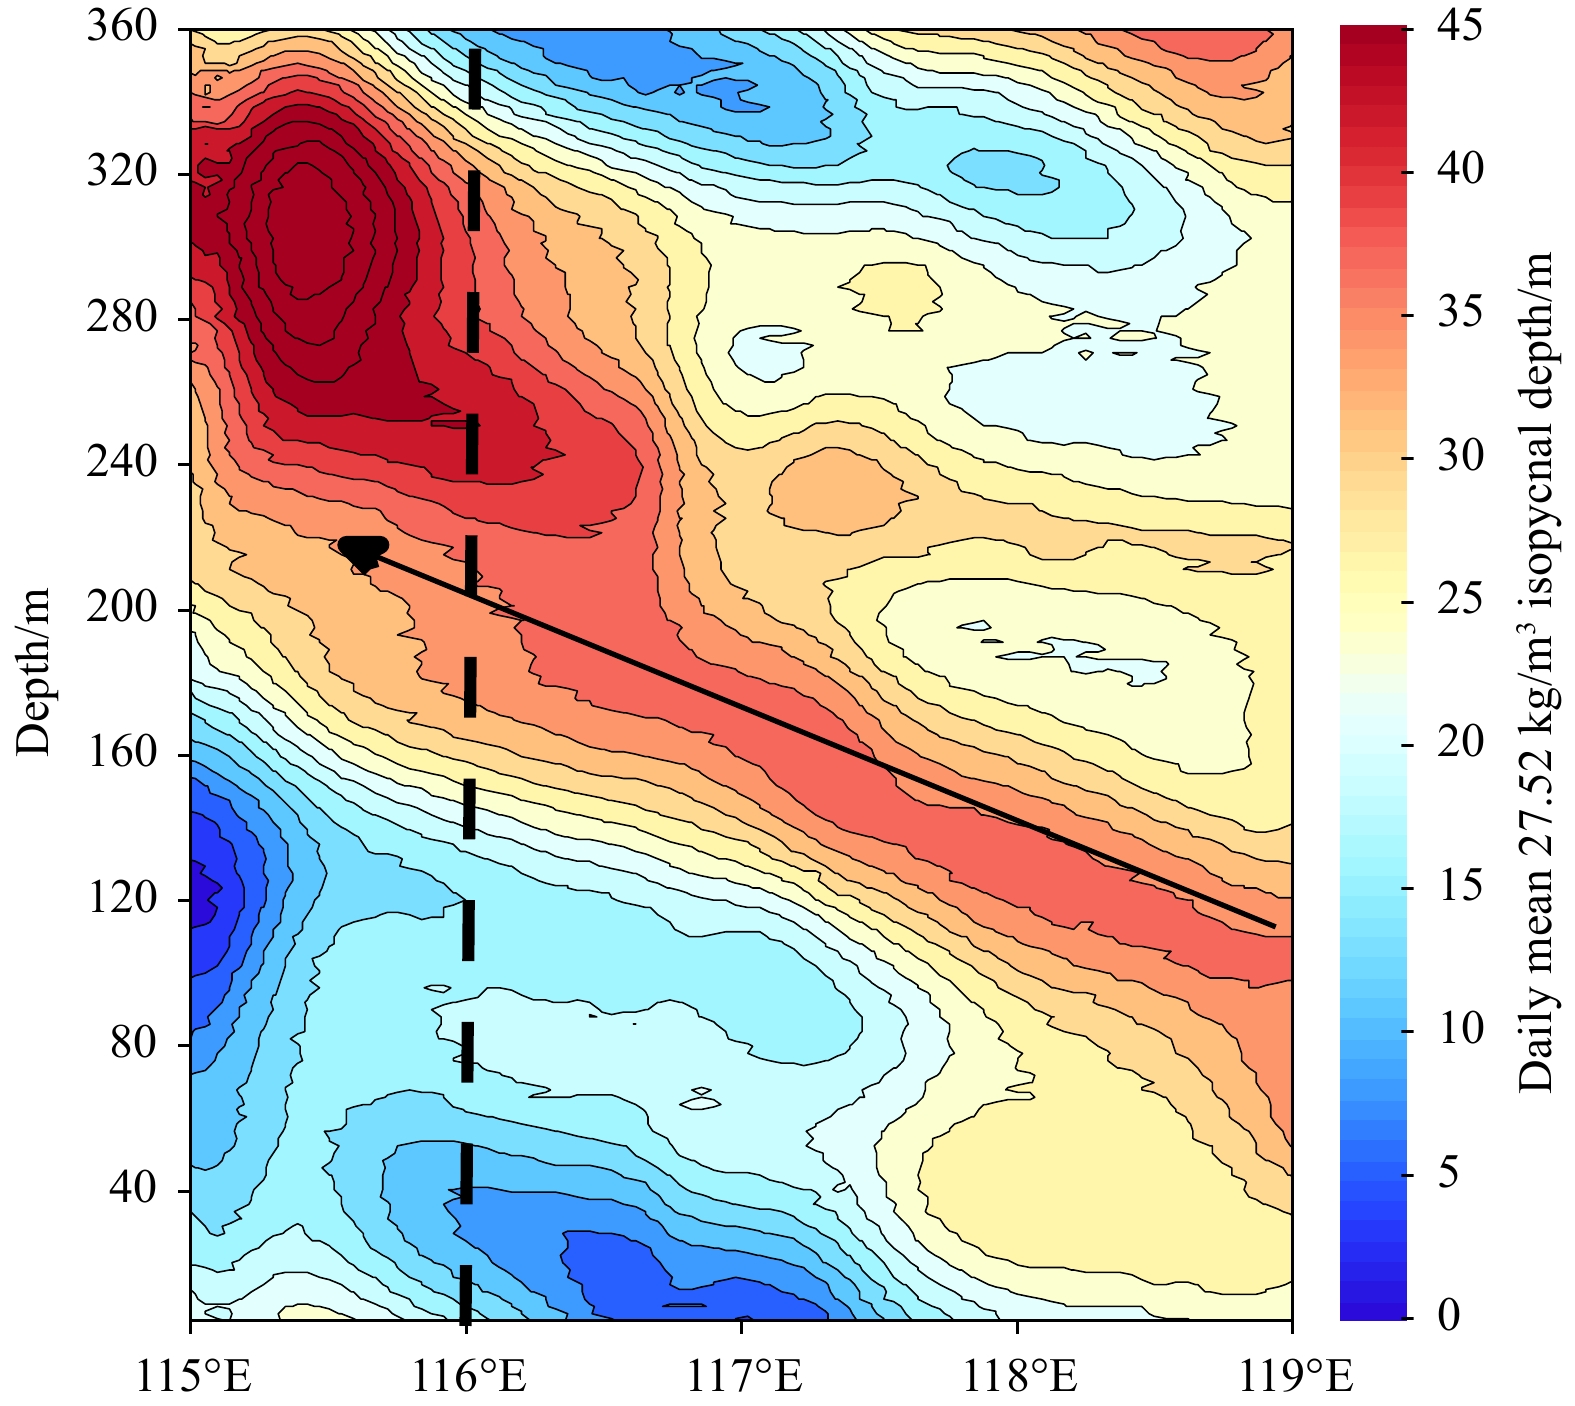
Figure 10. The Hovmueller diagram of the daily mean 27.52 kg/m3 isopycnal depth difference between the control experiment and the wind sensitivity experiment for 16°N. The black arrows show the signs propagating from the eastern boundary to the western boundary. Here, the area west of 116°E is defined as the western boundary.
Table 1. The PV dissipation in the SCS deep basin for each month
Month PV dissipation/(m2·s−2) Month PV dissipation/(m2·s−2) Jan. −0.171 Jul. −0.380 Feb. −0.281 Aug. −0.365 Mar. −0.249 Sept. −0.332 Apr. −0.156 Oct. −0.187 May −0.122 Nov. −0.173 Jun. −0.221 Dec. −0.168  下载: 导出CSV
-
[1] Baraille R, Filatoff N. 1995. Modèle shallow-water multicouches isopycnal de Miami. Rapport d’ Etude, CMO/RE No 003/95 [2] Bleck R, Smith L T. 1990. A wind-driven isopycnic coordinate model of the north and equatorial Atlantic Ocean: 1. Model development and supporting experiments. Journal of Geophysical Research: Oceans, 95(C3): 3273–3285. doi: 10.1029/JC095iC03p03273 [3] Carton J A, Chepurin G, Cao Xianhe. 2000. A simple ocean data assimilation analysis of the global upper ocean 1950–95. Part II: Results. Journal of Physical Oceanography, 30(2): 311–326. doi: 10.1175/1520-0485(2000)030<0311:ASODAA>2.0.CO;2 [4] Carton J A, Giese B S. 2008. A reanalysis of ocean climate using Simple Ocean Data Assimilation (SODA). Monthly Weather Review, 136(8): 2999–3017. doi: 10.1175/2007MWR1978.1 [5] Carton J A, Giese B S, Grodsky S A. 2005. Sea level rise and the warming of the oceans in the Simple Ocean Data Assimilation (SODA) ocean reanalysis. Journal of Geophysical Research: Oceans, 110(C9): C09006. doi: 10.1029/2004JC002817 [6] Chang Y T, Hsu W L, Tai J H, et al. 2010. Cold deep water in the South China Sea. Journal of Oceanography, 66(2): 183–190. doi: 10.1007/s10872-010-0016-x [7] Chao S Y, Shaw P T, Wu S Y. 1996. Deep water ventilation in the South China Sea. Deep Sea Research Part I: Oceanographic Research Papers, 43(4): 445–466. doi: 10.1016/0967-0637(96)00025-8 [8] Gan Jianping, Li H, Curchitser E N, et al. 2006. Modeling South China Sea circulation: Response to seasonal forcing regimes. Journal of Geophysical Research: Oceans, 111(C6): C06034. doi: 10.1029/2005JC003298 [9] Gan Jianping, Liu Zhiqiang, Hui R C. 2016. A three-layer alternating spinning circulation in the South China Sea. Journal of Physical Oceanography, 46(8): 2309–2315. doi: 10.1175/JPO-D-16-0044.1 [10] Hirschi J J M, Blaker A T, Sinha B, et al. 2013. Chaotic variability of the meridional overturning circulation on subannual to interannual timescales. Ocean Science, 9(5): 805–823. doi: 10.5194/os-9-805-2013 [11] Lan Jian, Wang Yu, Cui Fengjuan, et al. 2015. Seasonal variation in the South China Sea deep circulation. Journal of Geophysical Research: Oceans, 120(3): 1682–1690. doi: 10.1002/2014JC010413 [12] Lan Jian, Zhang Ningning, Wang Yu. 2013. On the dynamics of the South China Sea deep circulation. Journal of Geophysical Research: Oceans, 118(3): 1206–1210. doi: 10.1002/jgrc.20104 [13] Li Li, Qu Tangdong. 2006. Thermohaline circulation in the deep South China Sea basin inferred from oxygen distributions. Journal of Geophysical Research: Oceans, 111(C5): C05017. doi: 10.1029/2005JC003164 [14] Liu Zhiqiang, Gan Jianping. 2017. Three-dimensional pathways of water masses in the South China Sea: A modeling study. Journal of Geophysical Research: Oceans, 122(7): 6039–6054. doi: 10.1002/2016JC012511 [15] Pedlosky J. 1982. Geophysical Fluid Dynamics. Berlin: Springer-Verlag [16] Pedlosky J. 1996. Ocean Circulation Theory. Berlin: Springer-Verlag [17] Qu Tangdong, Girton J B, Whitehead J A. 2006. Deepwater overflow through Luzon Strait. Journal of Geophysical Research: Oceans, 111(C1): 311–330. doi: 10.1029/2005JC003139 [18] Shu Yeqiang, Xue Huijie, Wang Dongxiao, et al. 2014. Meridional overturning circulation in the South China Sea envisioned from the high-resolution global reanalysis data GLBa0.08. Journal of Geophysical Research: Oceans, 119(5): 3012–3028. doi: 10.1002/2013JC009583 [19] Sun Jia, Wang Guihua, Zuo Juncheng, et al. 2017. Role of surface warming in the northward shift of tropical cyclone tracks over the South China Sea in November. Acta Oceanologica Sinica, 36(5): 67–72. doi: 10.1007/s13131-017-1061-8 [20] Tang Shengquan, von Storch H, Chen Xueen, et al. 2019. “Noise” in climatologically driven ocean models with different grid resolution. Oceanologia, 61(3): 300–307. doi: 10.1016/j.oceano.2019.01.001 [21] Tang Shengquan, von Storch H, Chen Xueen. 2020. Atmospherically forced regional ocean simulations of the South China Sea: Scale dependency of the signal-to-noise ratio. Journal of Physical Oceanography, 50(1): 133–144. doi: 10.1175/JPO-D-19-0144.1 [22] Tian Jiwei, Qu Tangdong. 2012. Advances in research on the deep South China Sea circulation. Chinese Science Bulletin, 57(24): 3115–3120. doi: 10.1007/s11434-012-5269-x [23] Tian Jiwei, Yang Qingxuan, Liang Xinfeng, et al. 2006. Observation of Luzon Strait transport. Geophysical Research Letters, 33(19): L19607. doi: 10.1029/2006GL026272 [24] Wang Aimei, Du Yan, Peng Shiqiu, et al. 2018. Deep water characteristics and circulation in the South China Sea. Deep Sea Research Part I: Oceanographic Research Papers, 134: 55–63. doi: 10.1016/j.dsr.2018.02.003 [25] Wang Guihua, Huang Ruixin, Su Jilan, et al. 2012. The effects of thermohaline circulation on wind-driven circulation in the South China Sea. Journal of Physical Oceanography, 42(12): 2283–2296. doi: 10.1175/JPO-D-11-0227.1 [26] Wang Dongxiao, Xiao Jingen, Shu Yeqiang, et al. 2016. Progress on deep circulation and meridional overturning circulation in the South China Sea. Science China Earth Sciences, 59(9): 1827–1833. doi: 10.1007/s11430-016-5324-6 [27] Wang Guihua, Xie Shangping, Qu Tangdong, et al. 2011. Deep South China Sea circulation. Geophysical Research Letters, 38(5): L05601. doi: 10.1029/2010GL046626 [28] Xie Qiang, Xiao Jingen, Wang Dongxiao, et al. 2013. Analysis of deep-layer and bottom circulations in the South China Sea based on eight quasi-global ocean model outputs. Chinese Science Bulletin, 58(32): 4000–4011. doi: 10.1007/s11434-013-5791-5 [29] Yan Junyue. 1997. Climatological characteristics on the onset of the South China Sea southwest monsoon. Acta Meteorologica Sinica, 55(2): 174–186 [30] Yang Jiayan. 2005. The arctic and subarctic ocean flux of potential vorticity and the Arctic Ocean circulation. Journal of Physical Oceanography, 35(12): 2387–2407. doi: 10.1175/JPO2819.1 [31] Yang Jiayan. 2015. Local and remote wind stress forcing of the seasonal variability of the Atlantic Meridional Overturning Circulation (AMOC) transport at 26.5°N. Journal of Geophysical Research: Oceans, 120(4): 2488–2503. doi: 10.1002/2014JC010317 [32] Yang Jiayan, Price J F. 2000. Water-mass formation and potential vorticity balance in an abyssal ocean circulation. Journal of Marine Research, 58(5): 789–808. doi: 10.1357/002224000321358918 [33] Yang Jiayan, Price J F. 2007. Potential vorticity constraint on the flow between two basins. Journal of Physical Oceanography, 37(9): 2251–2266. doi: 10.1175/JPO3116.1 [34] Yuan Dongliang. 2002. A numerical study of the South China Sea deep circulation and its relation to the Luzon Strait transport. Acta Oceanologica Sinica, 21(2): 187–202 [35] Zhao Wei, Zhou Chun, Tian Jiwei, et al. 2014. Deep water circulation in the Luzon Strait. Journal of Geophysical Research: Oceans, 119(2): 790–804. doi: 10.1002/2013JC009587 [36] Zhao Xiaolong, Zhou Chun, Zhao Wei, et al. 2016. Deepwater overflow observed by three bottom-anchored moorings in the Bashi Channel. Deep Sea Research Part I: Oceanographic Research Papers, 110: 65–74. doi: 10.1016/j.dsr.2016.01.007 [37] Zhou Chun, Zhao Wei, Tian Jiwei, et al. 2014. Variability of the deep-water overflow in the Luzon Strait. Journal of Physical Oceanography, 44(11): 2972–2986. doi: 10.1175/JPO-D-14-0113.1 [38] Zhou Chun, Zhao Wei, Tian Jiwei, et al. 2017. Deep western boundary current in the South China Sea. Scientific Reports, 7: 9303. doi: 10.1038/s41598-017-09436-2 [39] Zhu Yaohua, Fang Guohong, Wei Zexun, et al. 2016. Seasonal variability of the meridional overturning circulation in the South China Sea and its connection with inter-ocean transport based on SODA2.2.4. Journal of Geophysical Research: Oceans, 121(5): 3090–3105. doi: 10.1002/2015JC011443 -


 点击查看大图
计量
- 文章访问数: 399
- HTML全文浏览量: 125
- PDF下载量: 27
- 被引次数: 0

