

Using triple oxygen isotopes and oxygen-argon ratio to quantify ecosystem production in the mixed layer of northern South China Sea slope region
-
Abstract: Quantifying the gross and net production is an essential component of carbon cycling and marine ecosystem studies. Triple oxygen isotope measurements and the O2/Ar ratio are powerful indices in quantifying the gross primary production and net community production of the mixed layer zone, respectively. Although there is a substantial advantage in refining the gas exchange term and water column vertical mixing calibration, application of mixed layer depth history to the gas exchange term and its contribution to reducing indices error are unclear. Therefore, two cruises were conducted in the slope regions of the northern South China Sea in October 2014 (autumn) and June 2015 (spring). Discrete water samples at Station L07 in the upper 150 m depth were collected for the determination of δ17O, δ18O, and the O2/Ar ratio of dissolved gases. Gross oxygen production (GOP) was estimated using the triple oxygen isotopes of the dissolved O2, and net oxygen production (NOP) was calculated using O2/Ar ratio and O2 concentration. The vertical mixing effect in NOP was calibrated via a N2O based approach. GOP for autumn and spring was (169±23) mmol/(m2·d) (by O2) and (189±26) mmol/(m2·d) (by O2), respectively. While NOP was 1.5 mmol/(m2·d) (by O2) in autumn and 8.2 mmol/(m2·d) (by O2) in spring. Application of mixed layer depth history in the gas flux parametrization reduced up to 9.5% error in the GOP and NOP estimations. A comparison with an independent O2 budget calculation in the diel observation indicated a 26% overestimation in the current GOP, likely due to the vertical mixing effect. Both GOP and NOP in June were higher than those in October. Potential explanations for this include the occurrence of an eddy process in June, which may have exerted a submesoscale upwelling at the sampling station, and also the markedly higher terrestrial impact in June.
-
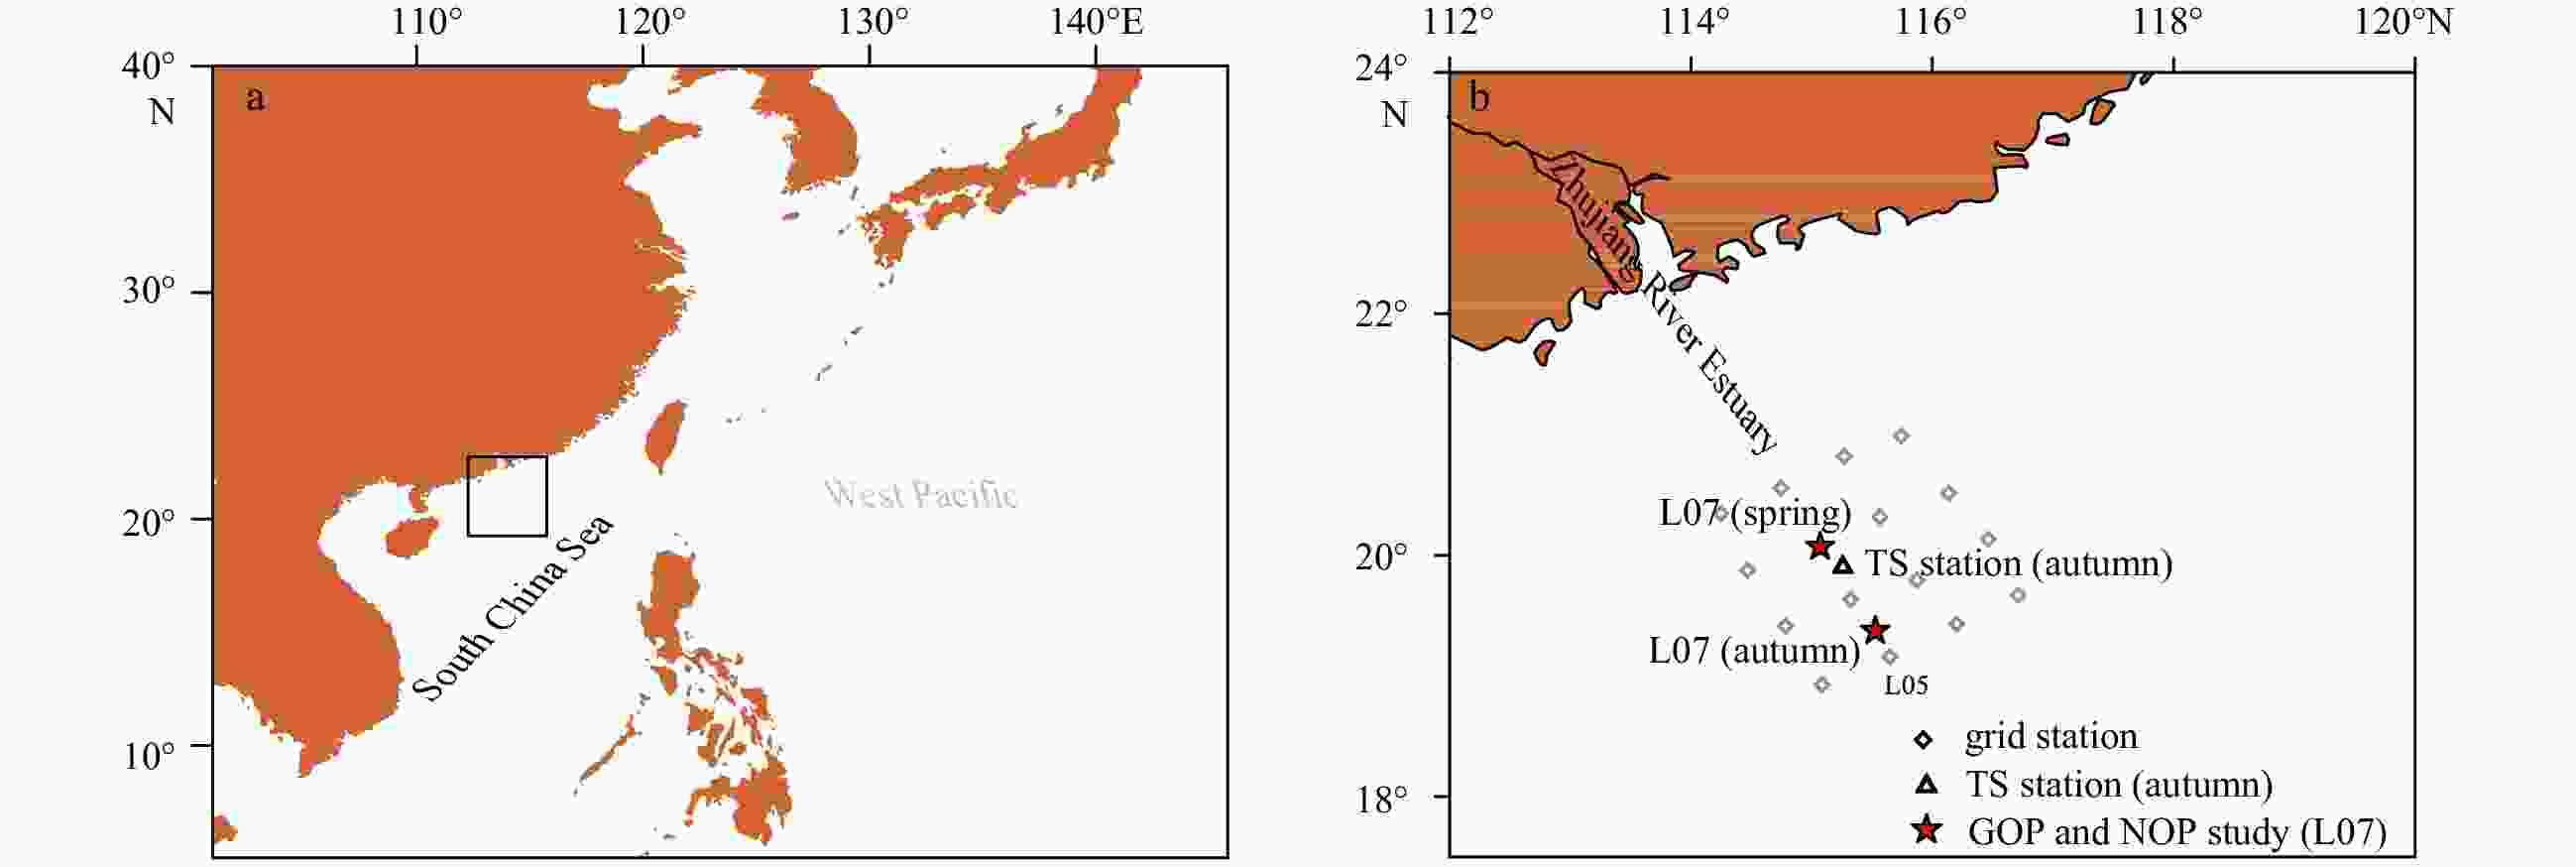
Figure 1. Study area (a) and sampling stations (b). In image a, the black box indicates the location of plot b. GOP represents gross oxygen production, NOP net oxygen production, and TS time series station.
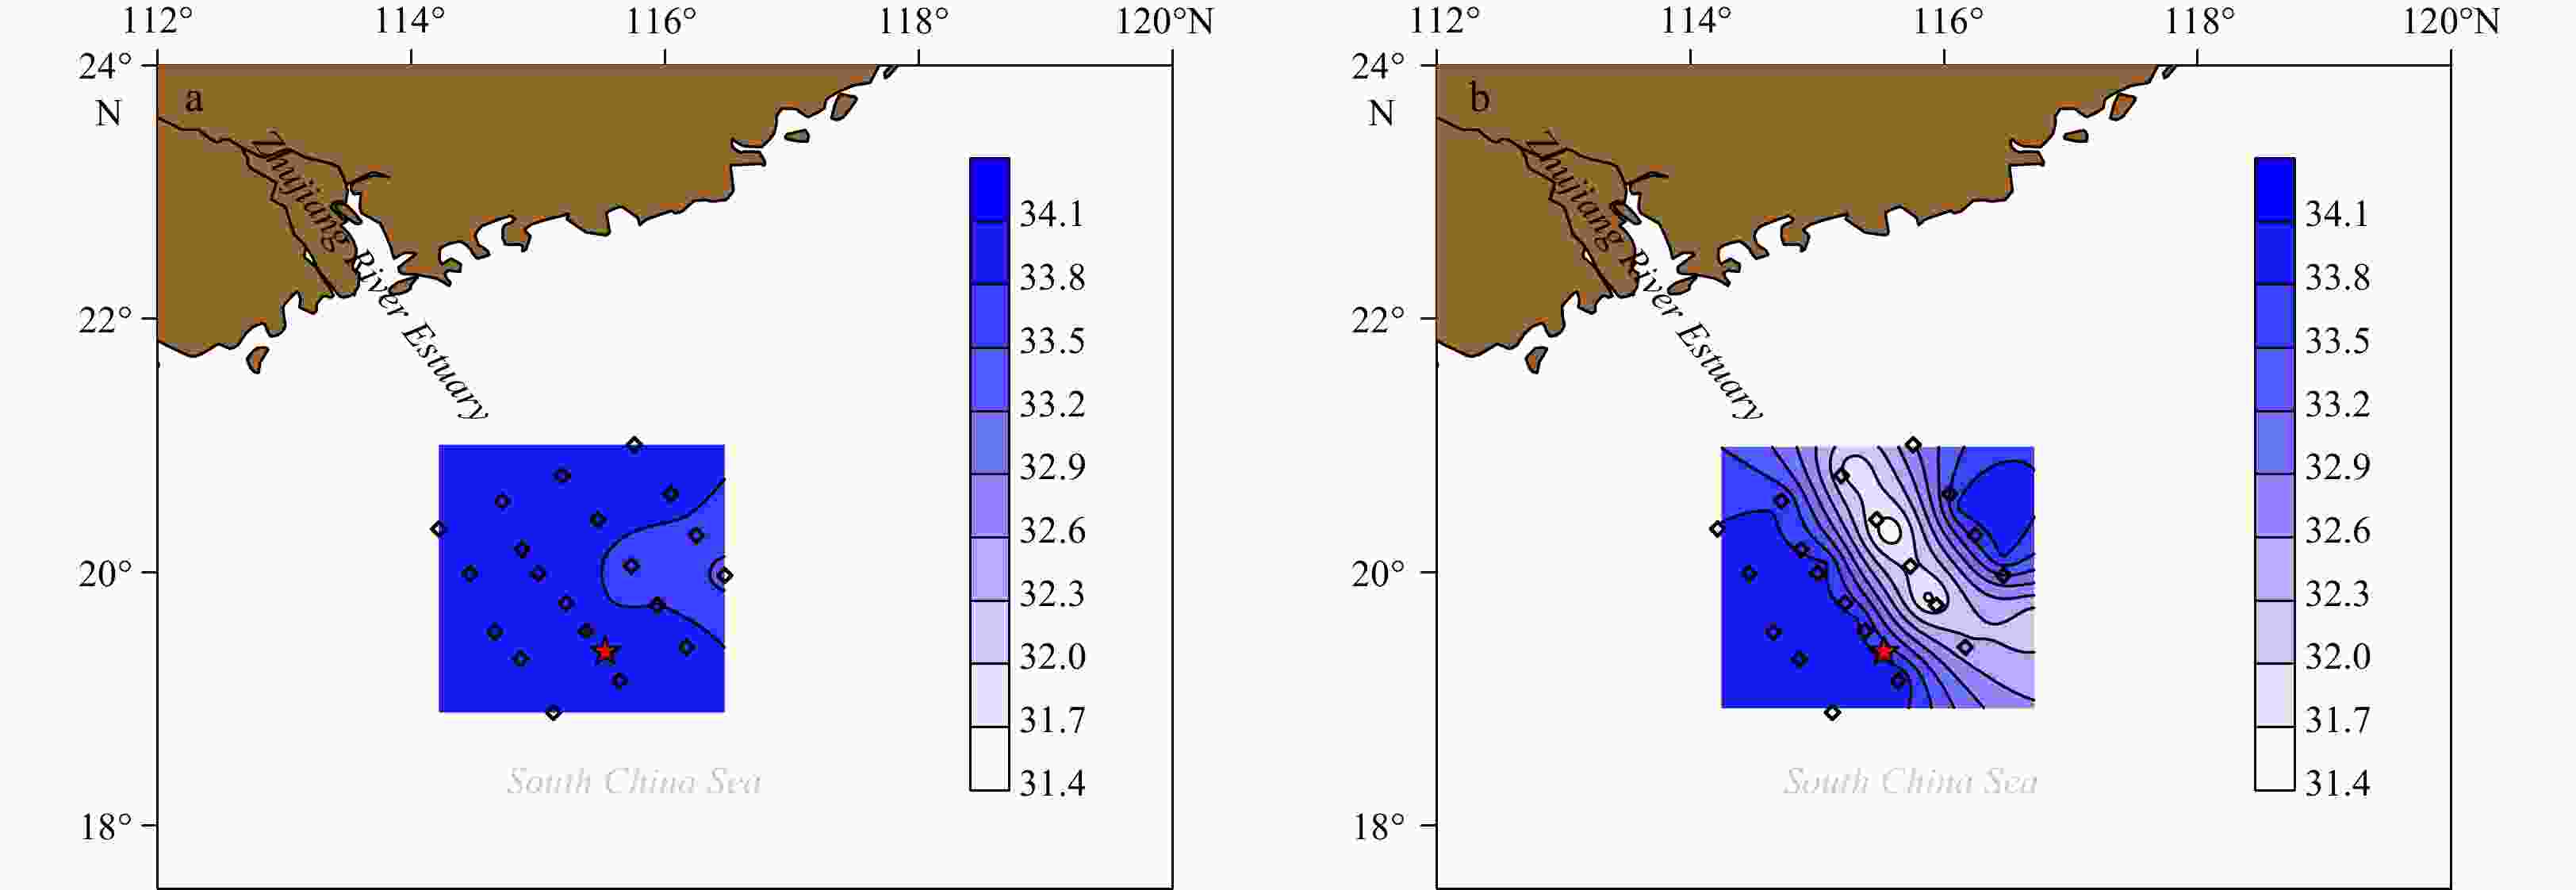
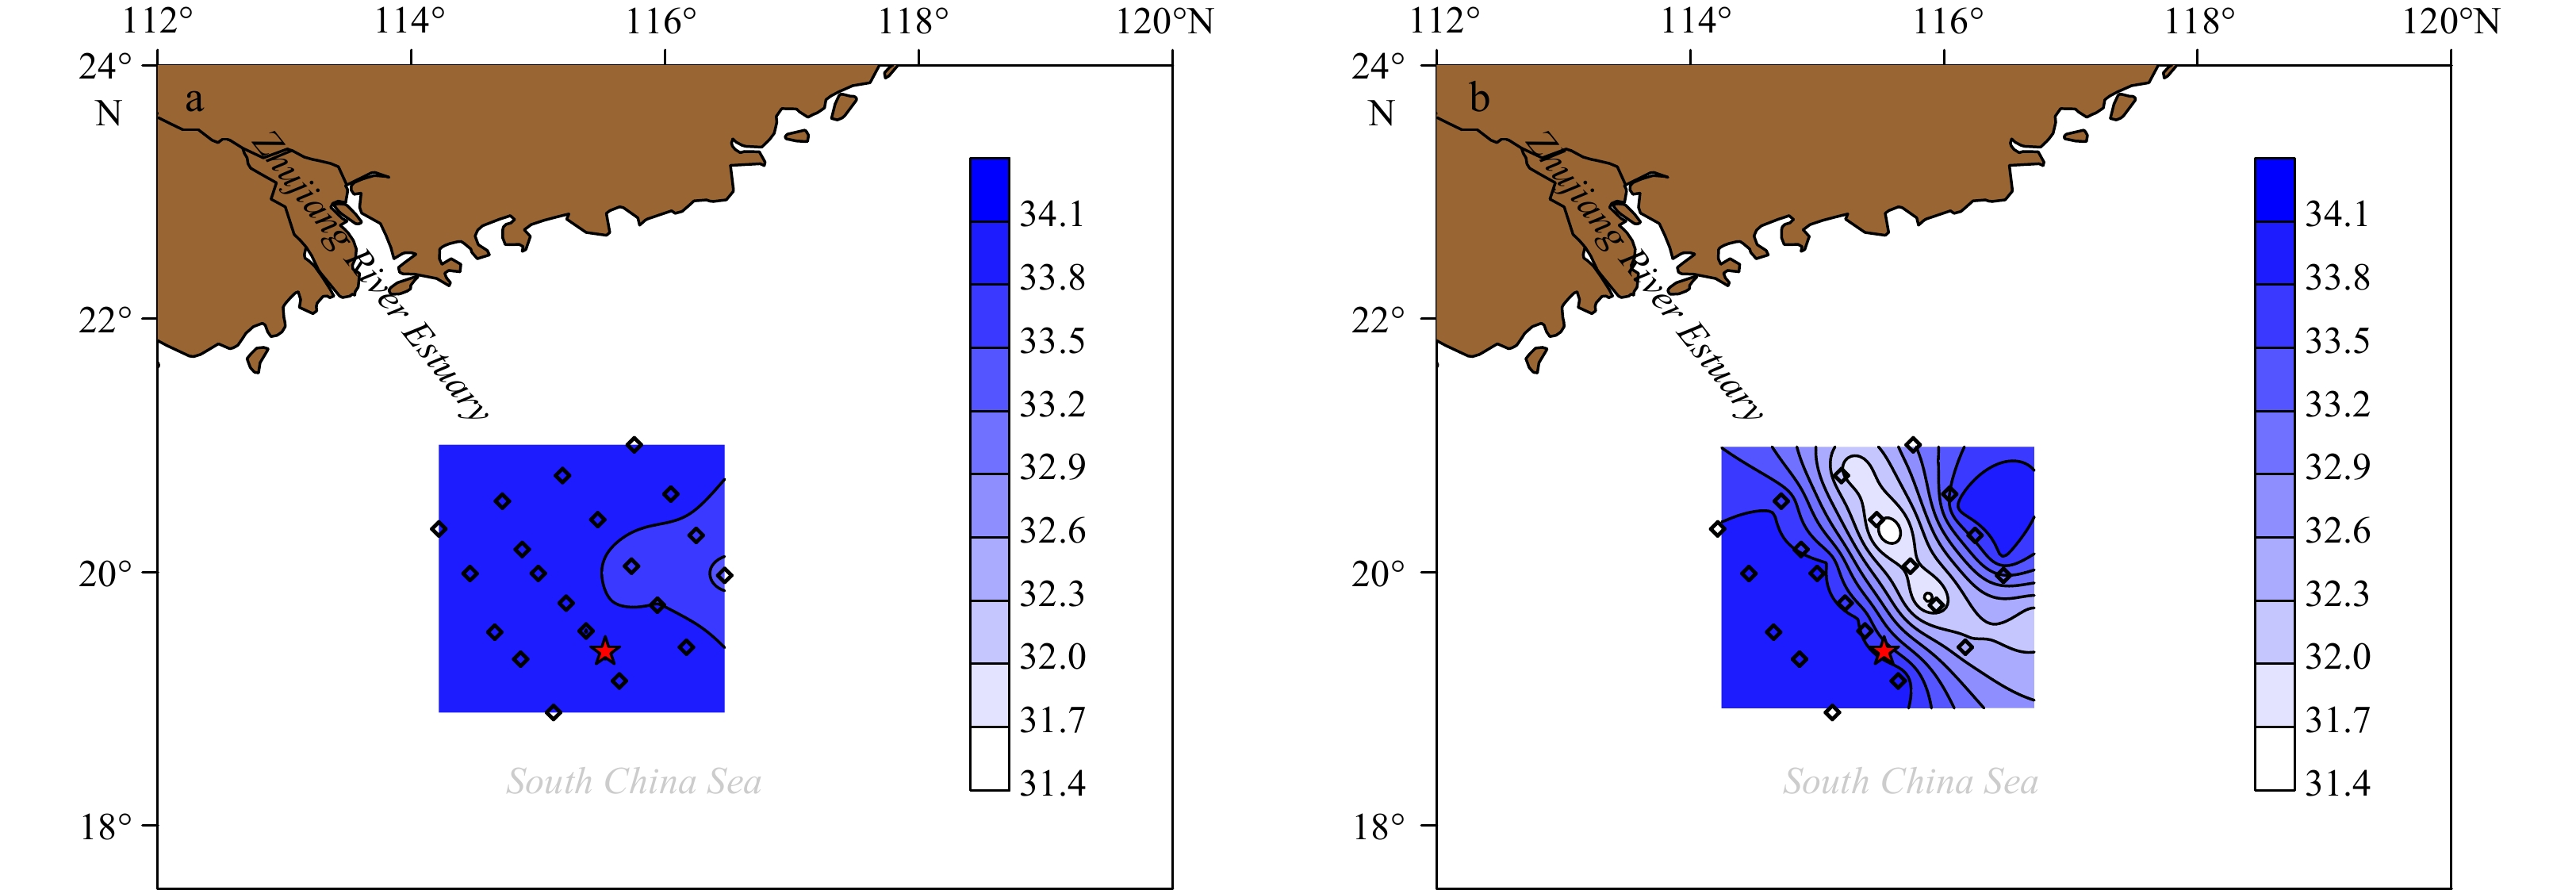
Figure 2. Surface salinity distribution in October 2014 (a) and June 2015 (b) as revealed by grid stations (diamonds). The red star indicates the location of Station L07 where O2 samples were collected. Note that salinity ranges and gradients in both seasons are the same.
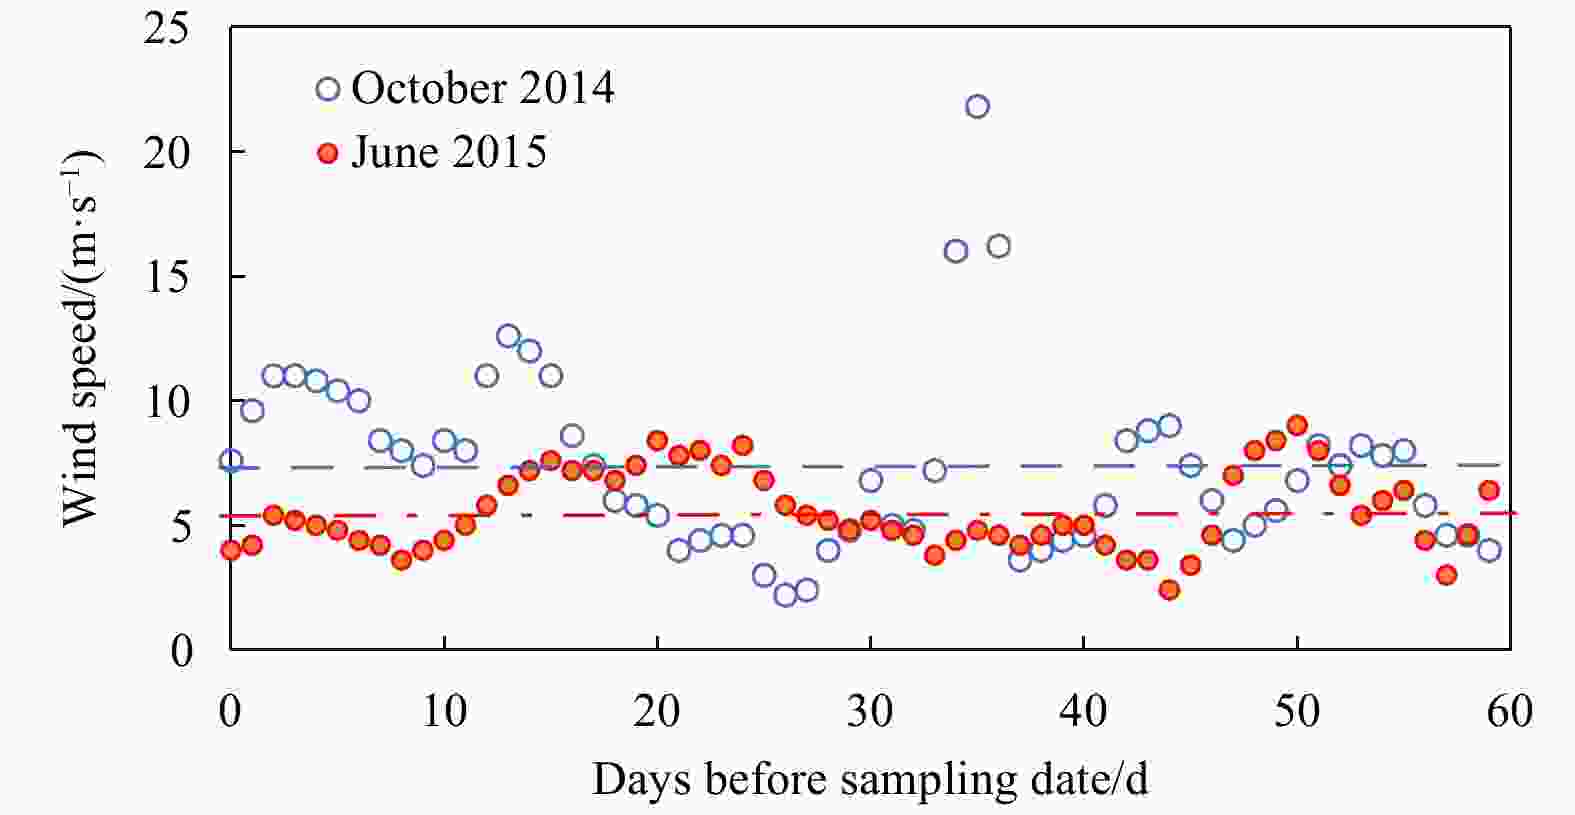
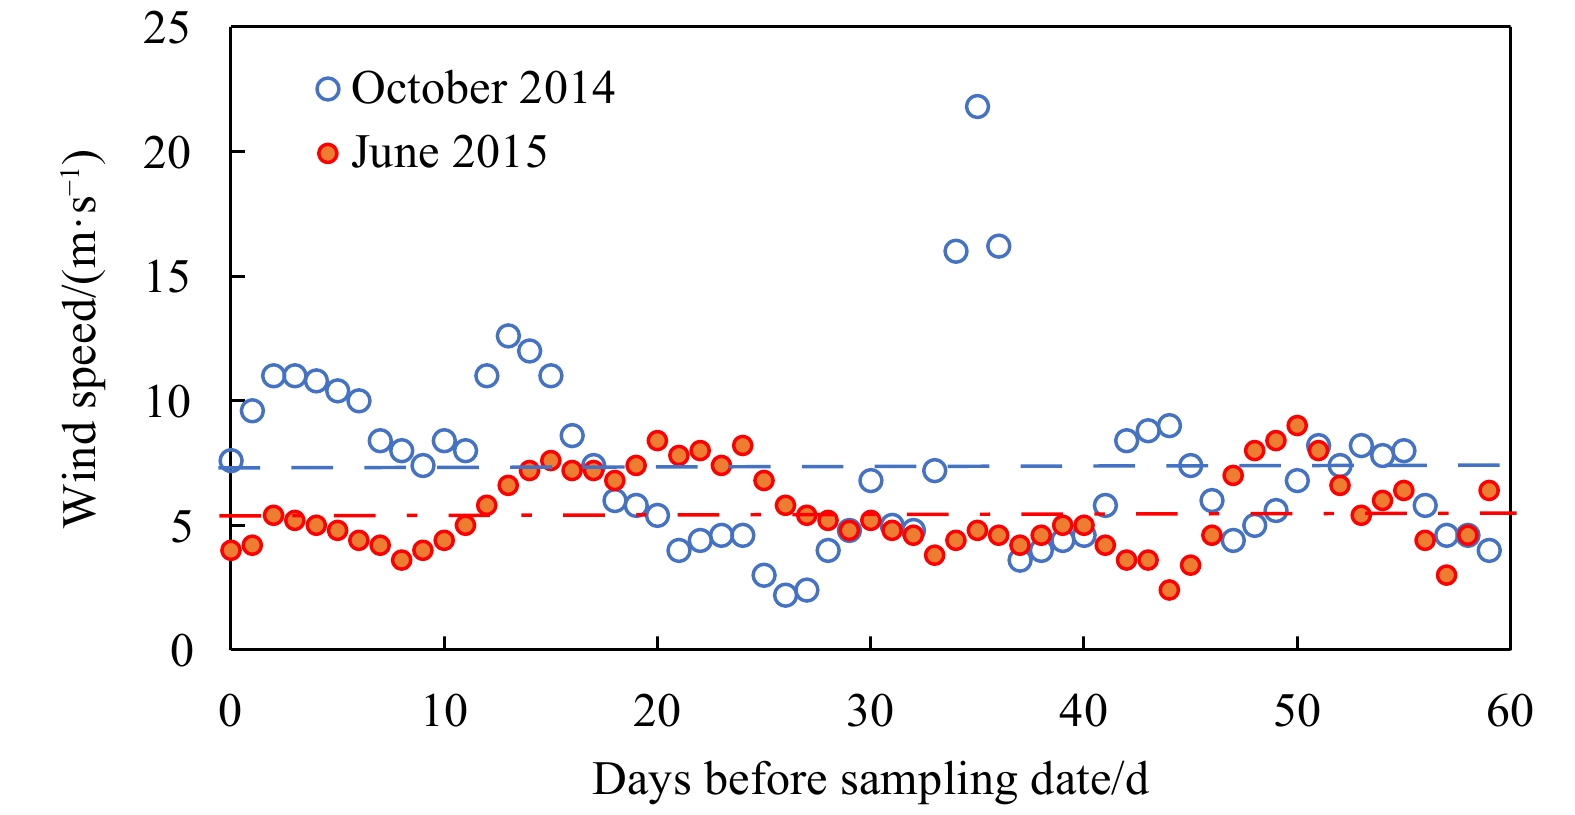
Figure 3. Wind speed before the sampling date (0 d is the sampling date). The blue dashed line (7.4 m/s) indicates the mean wind speed of the 60 d for observation in 2014 and the red dashed-dot line (5.6 m/s) indicates that for 2015. Data derived from
www.remss.com .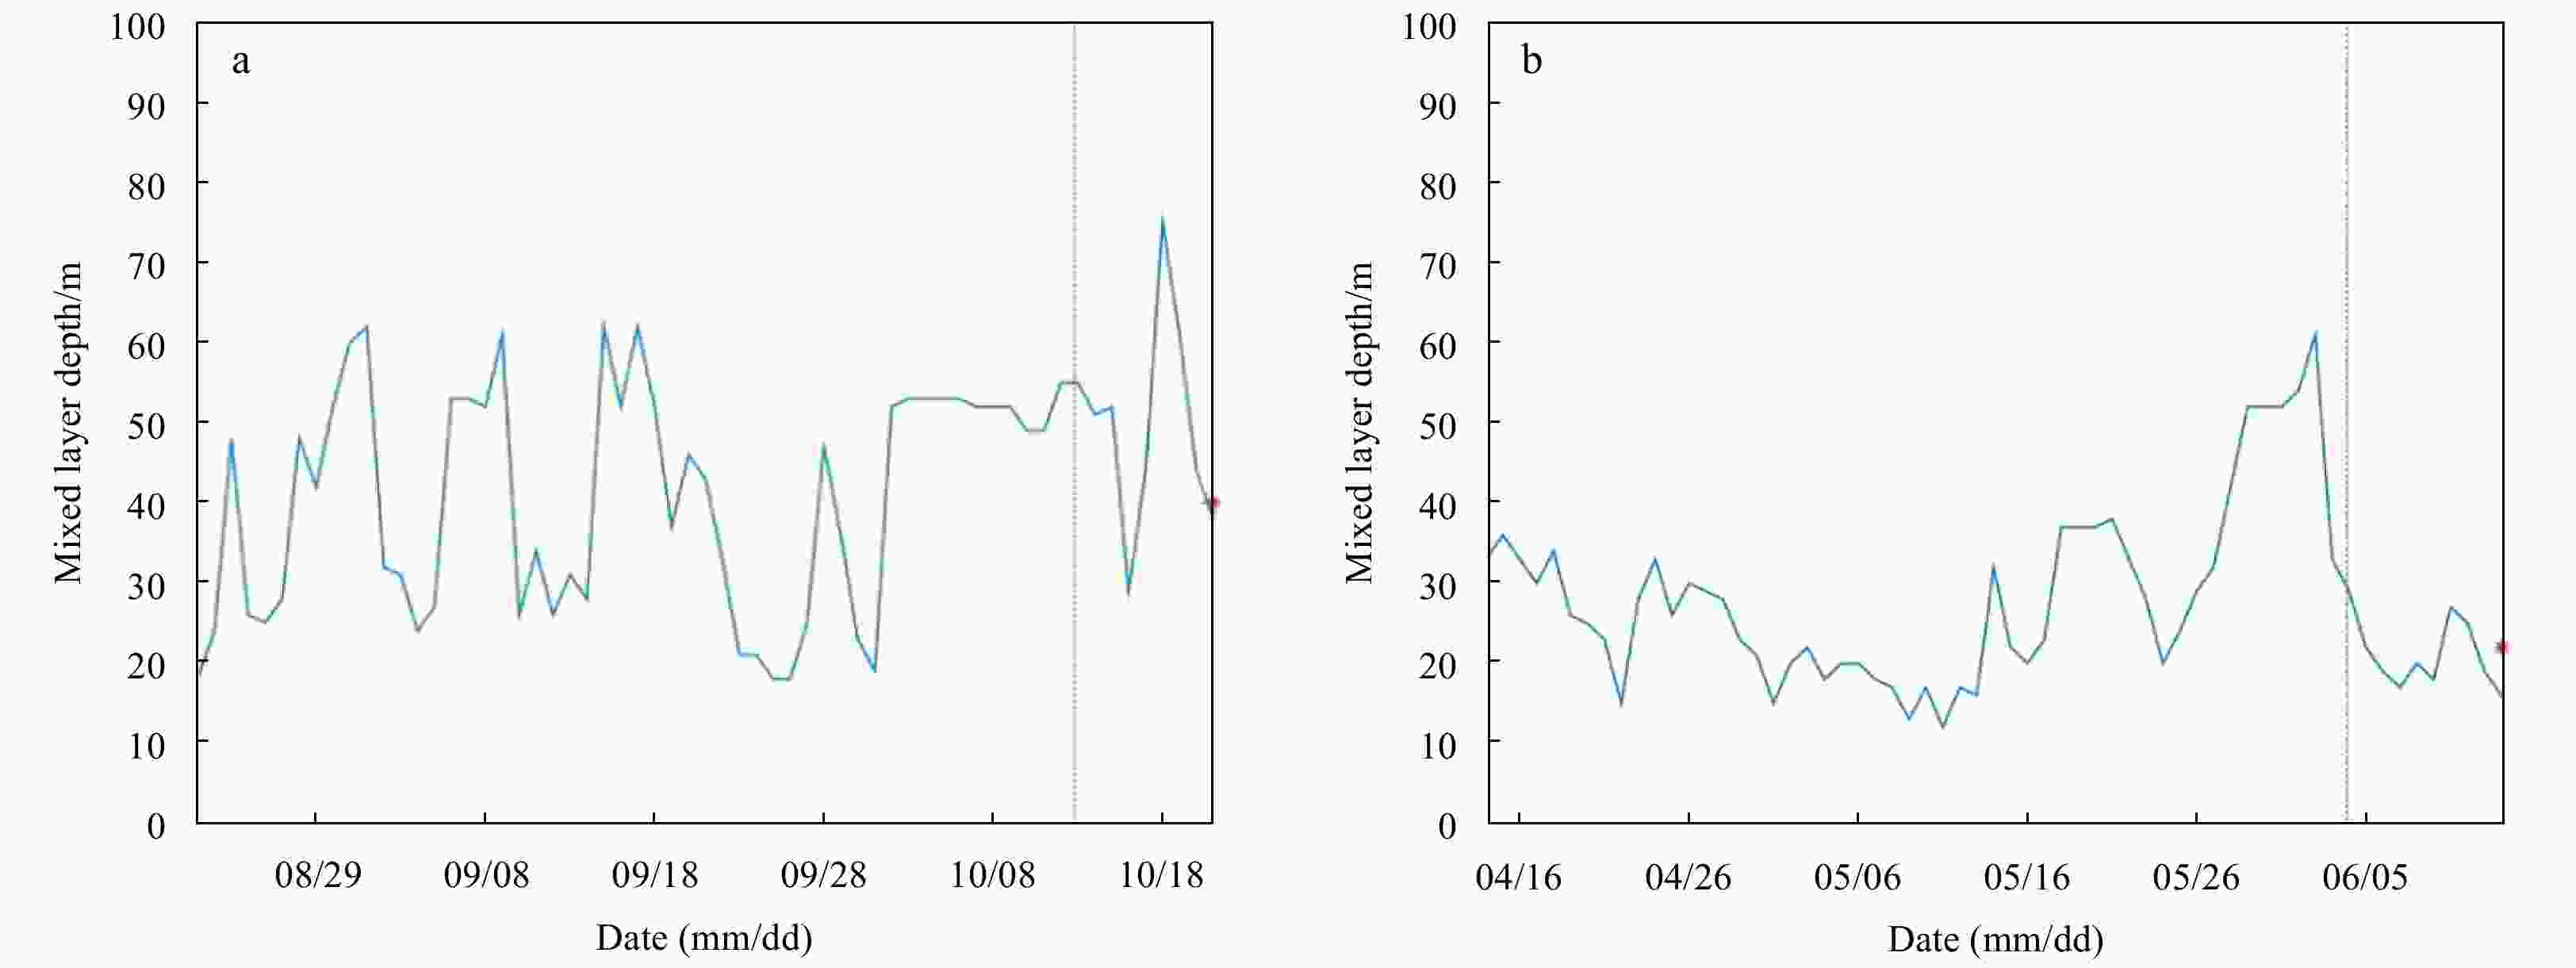
Figure 4. Modeled mixed layer depth history until the sampling date (a. October 2014; b. June 2015). The observed mixed layer depth at the sampling date is shown as the red asterisk on the right y axis. The black dashed line indicates 5 d (a) and 8.5 d (b) before the sampling date, which gets close to the O2 residence time within the mixed layer. The bottom layer of the mixed layer criteria is a 0.125 kg/m3 difference from the surface. Note that the x-axis is reverse in direction relative to Fig. 3.
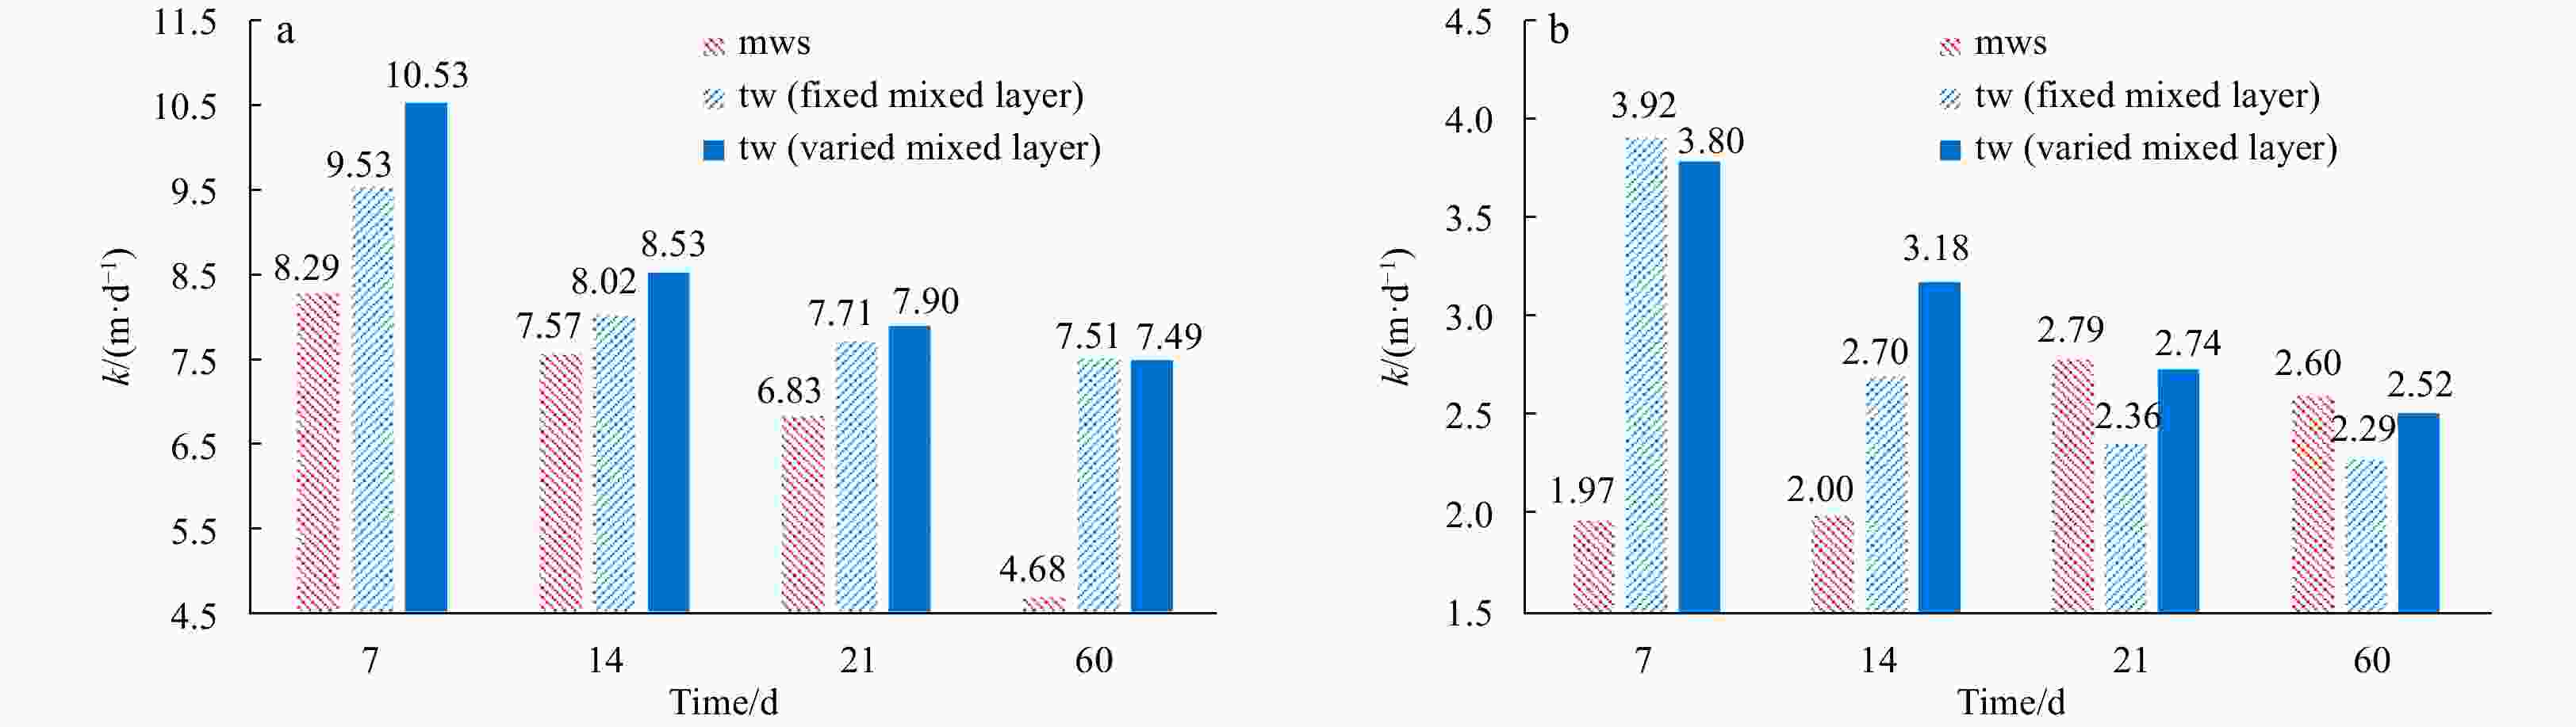
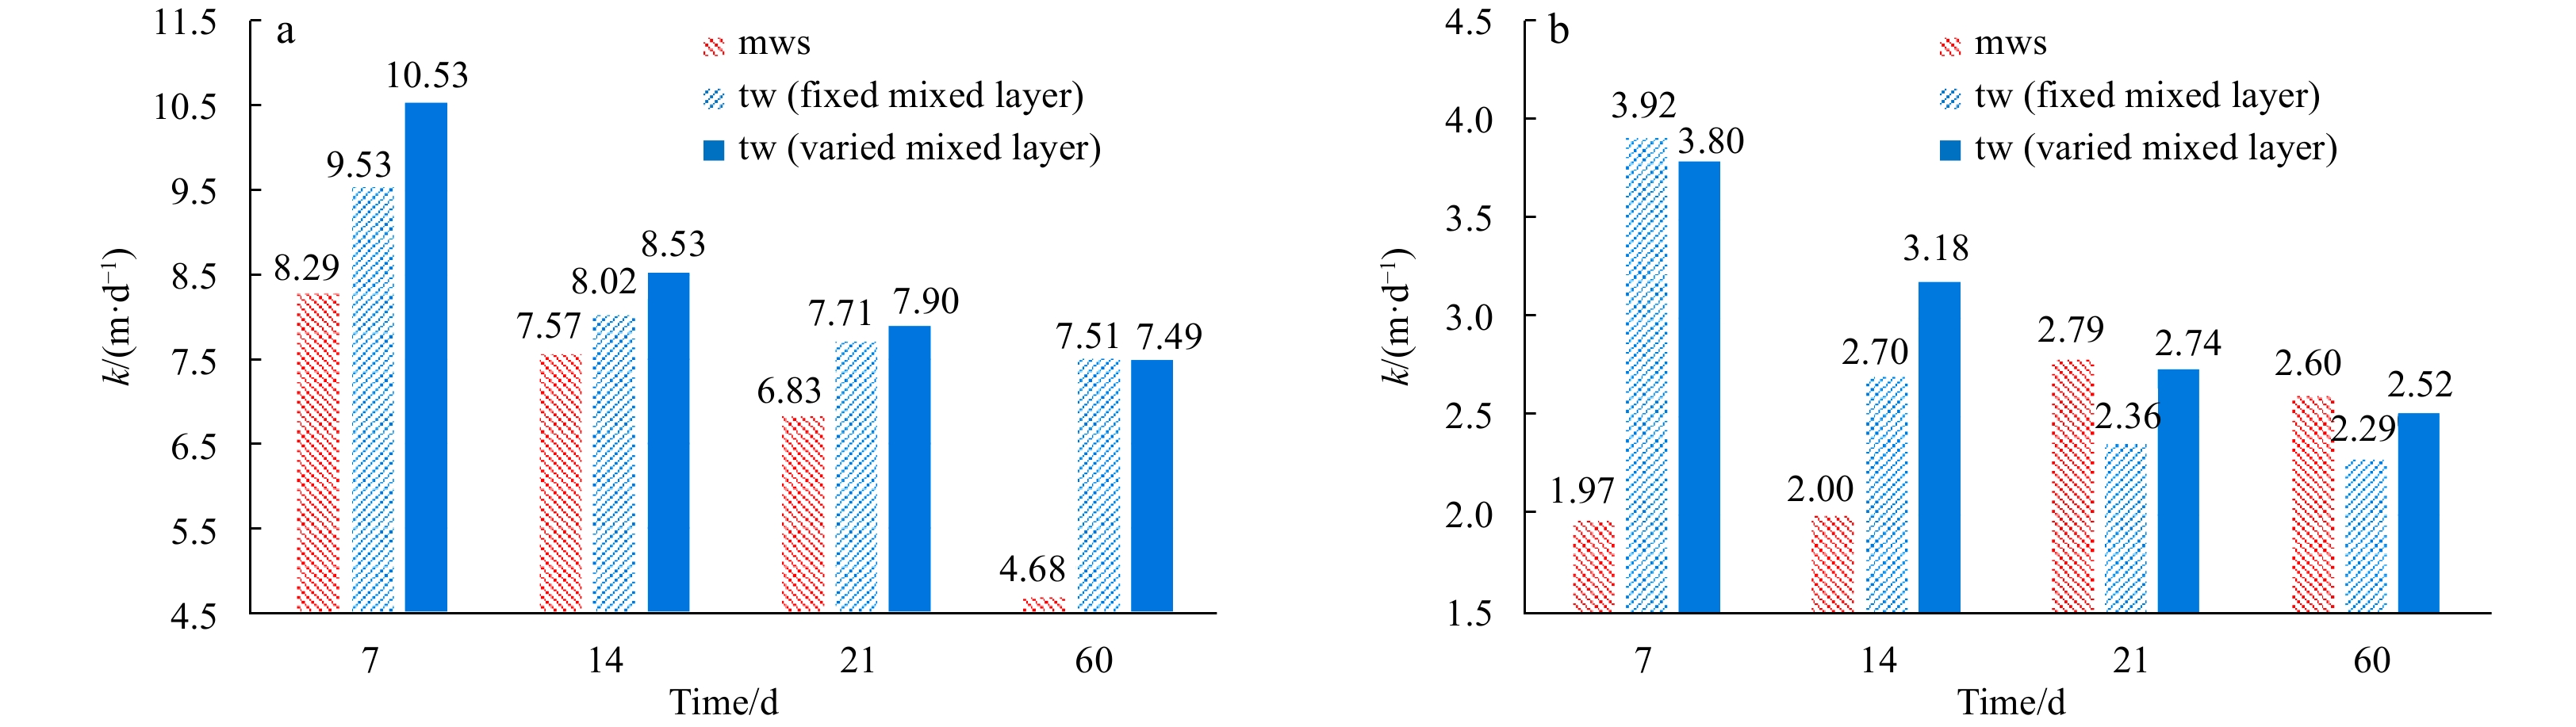
Figure 5. Pooled piston velocity k values in October 2014 (a) and June 2015 (b). mws, mean wind speed method (k″ in the text); tw (fixed mixed layer), time-weighted method with mixed layer unchanged (k′ in the text); tw (varied mixed layer), time-weighted method with mixed layer changed. Note that 7.49 and 2.52 were accepted as the k value in calculating the gross oxygen production for October 2014 and June 2015, respectively, and the x axis is disproportional.
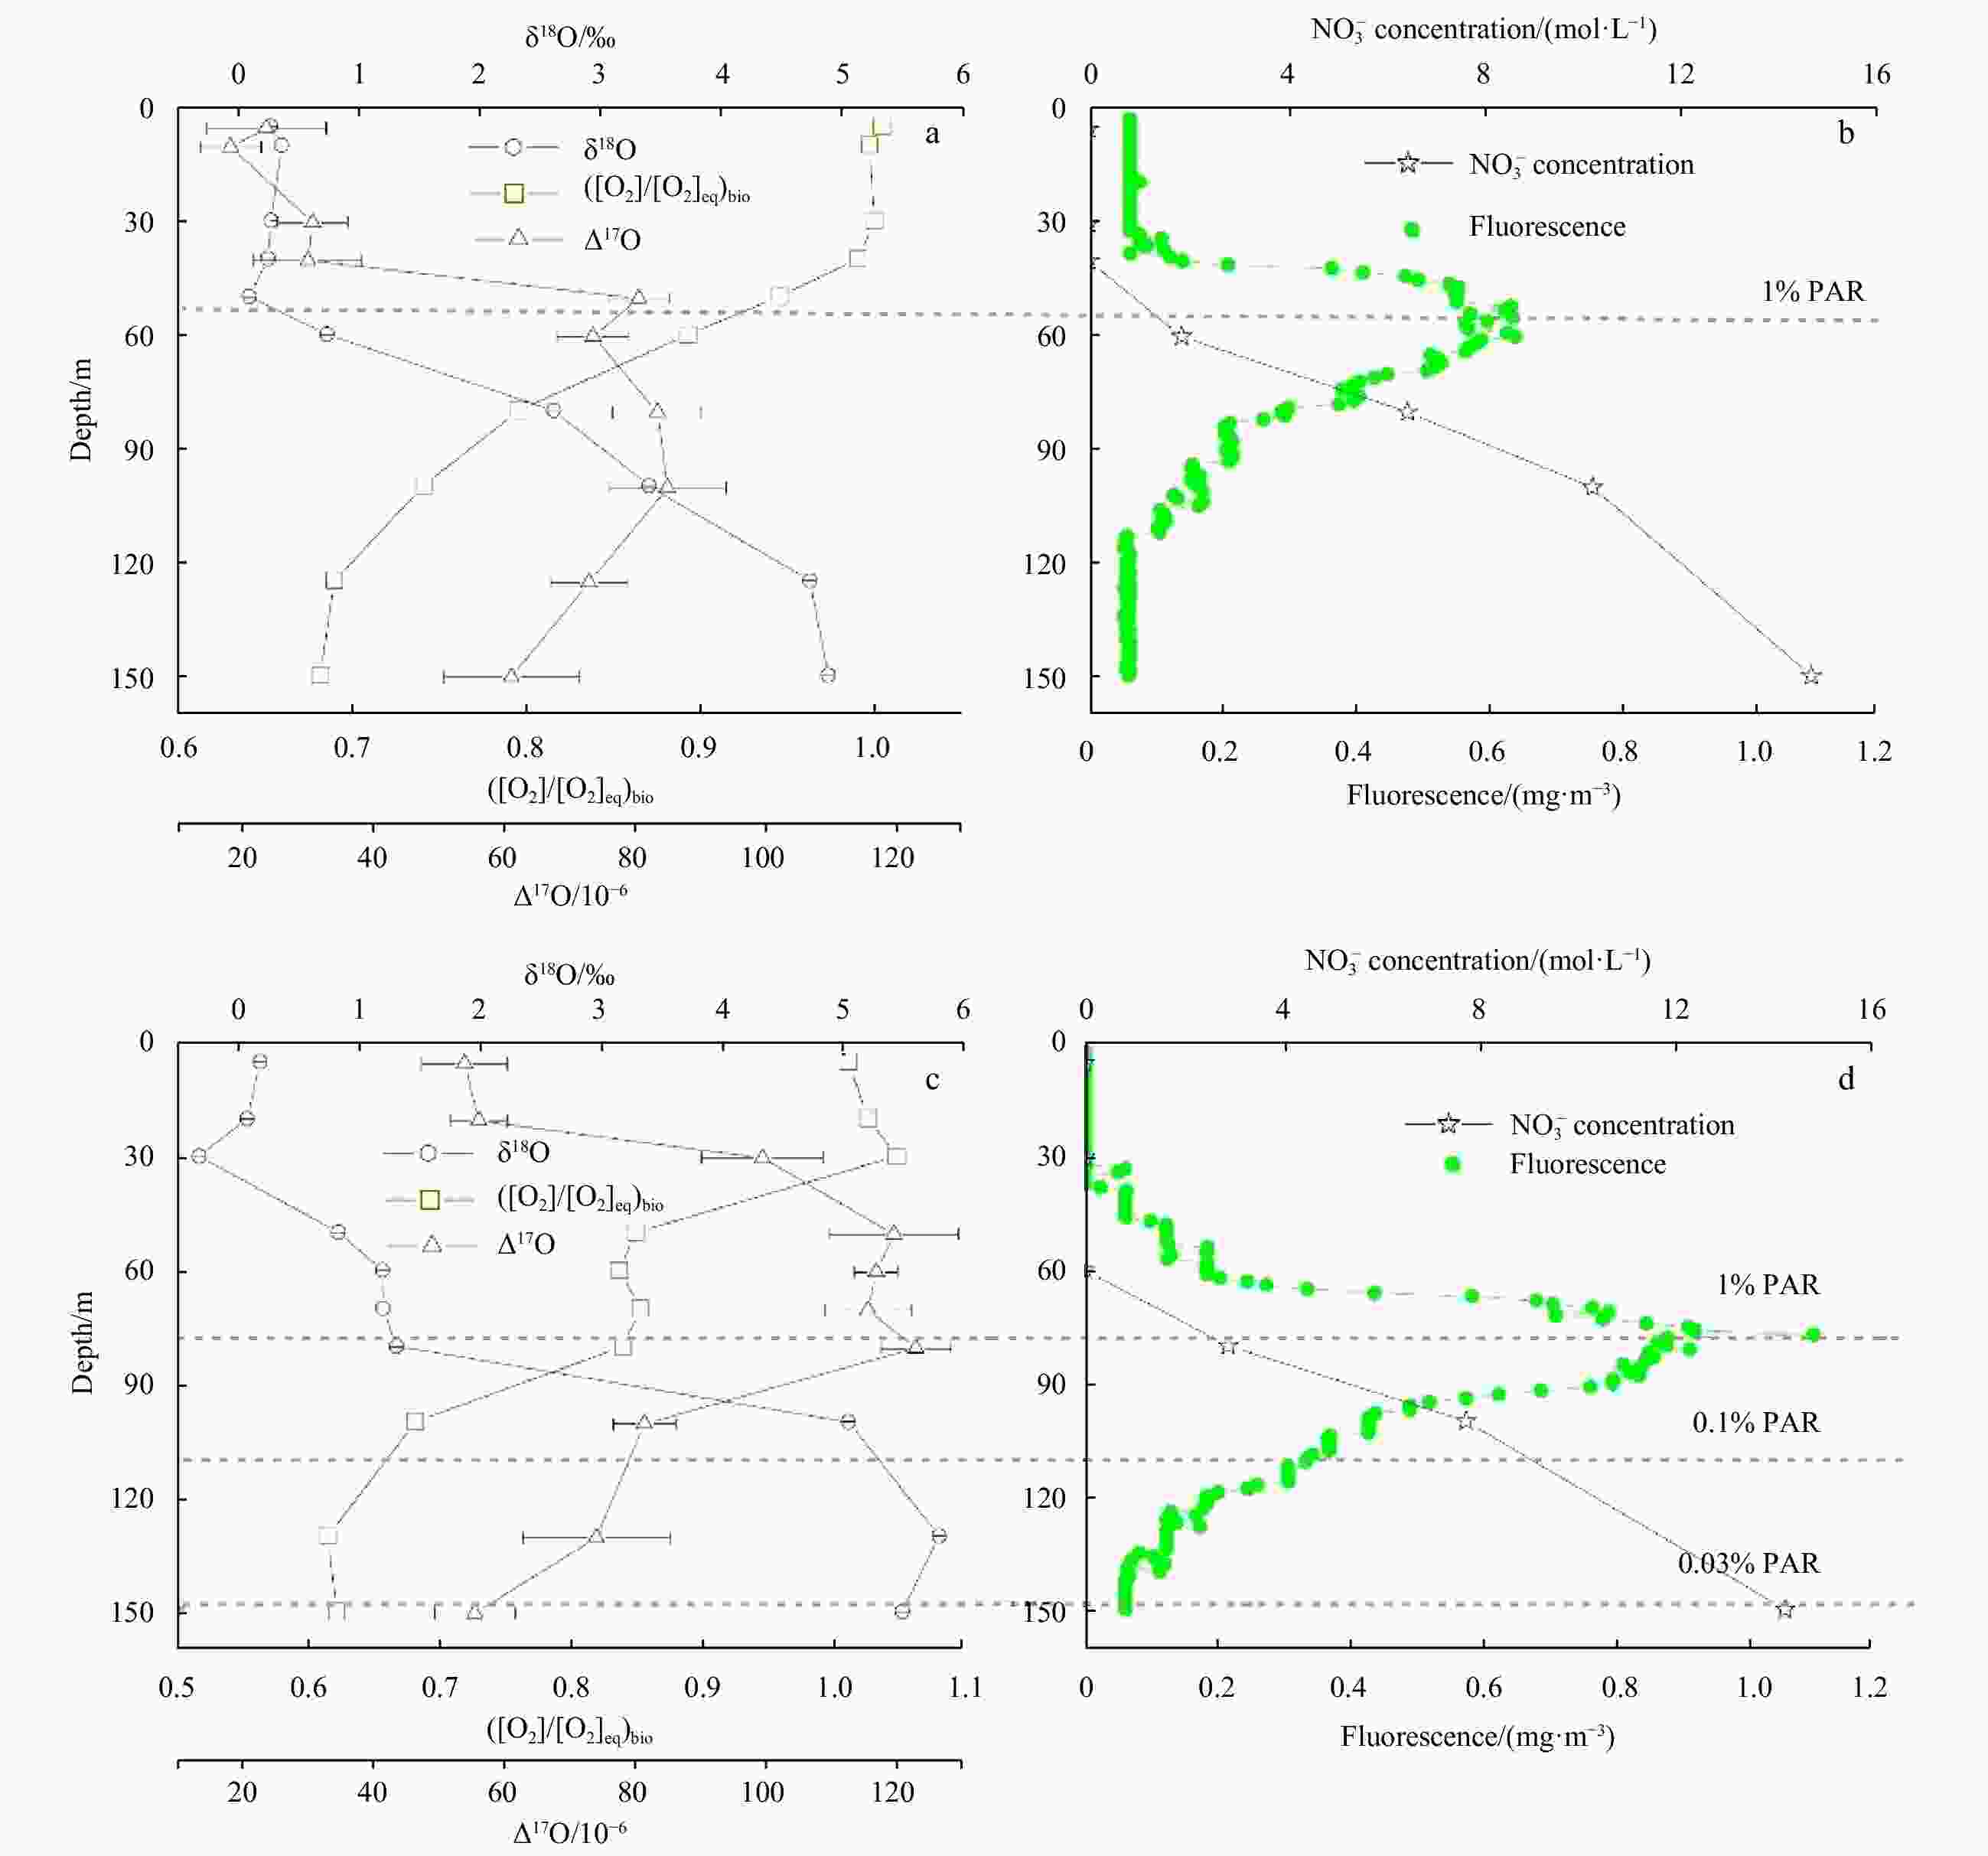
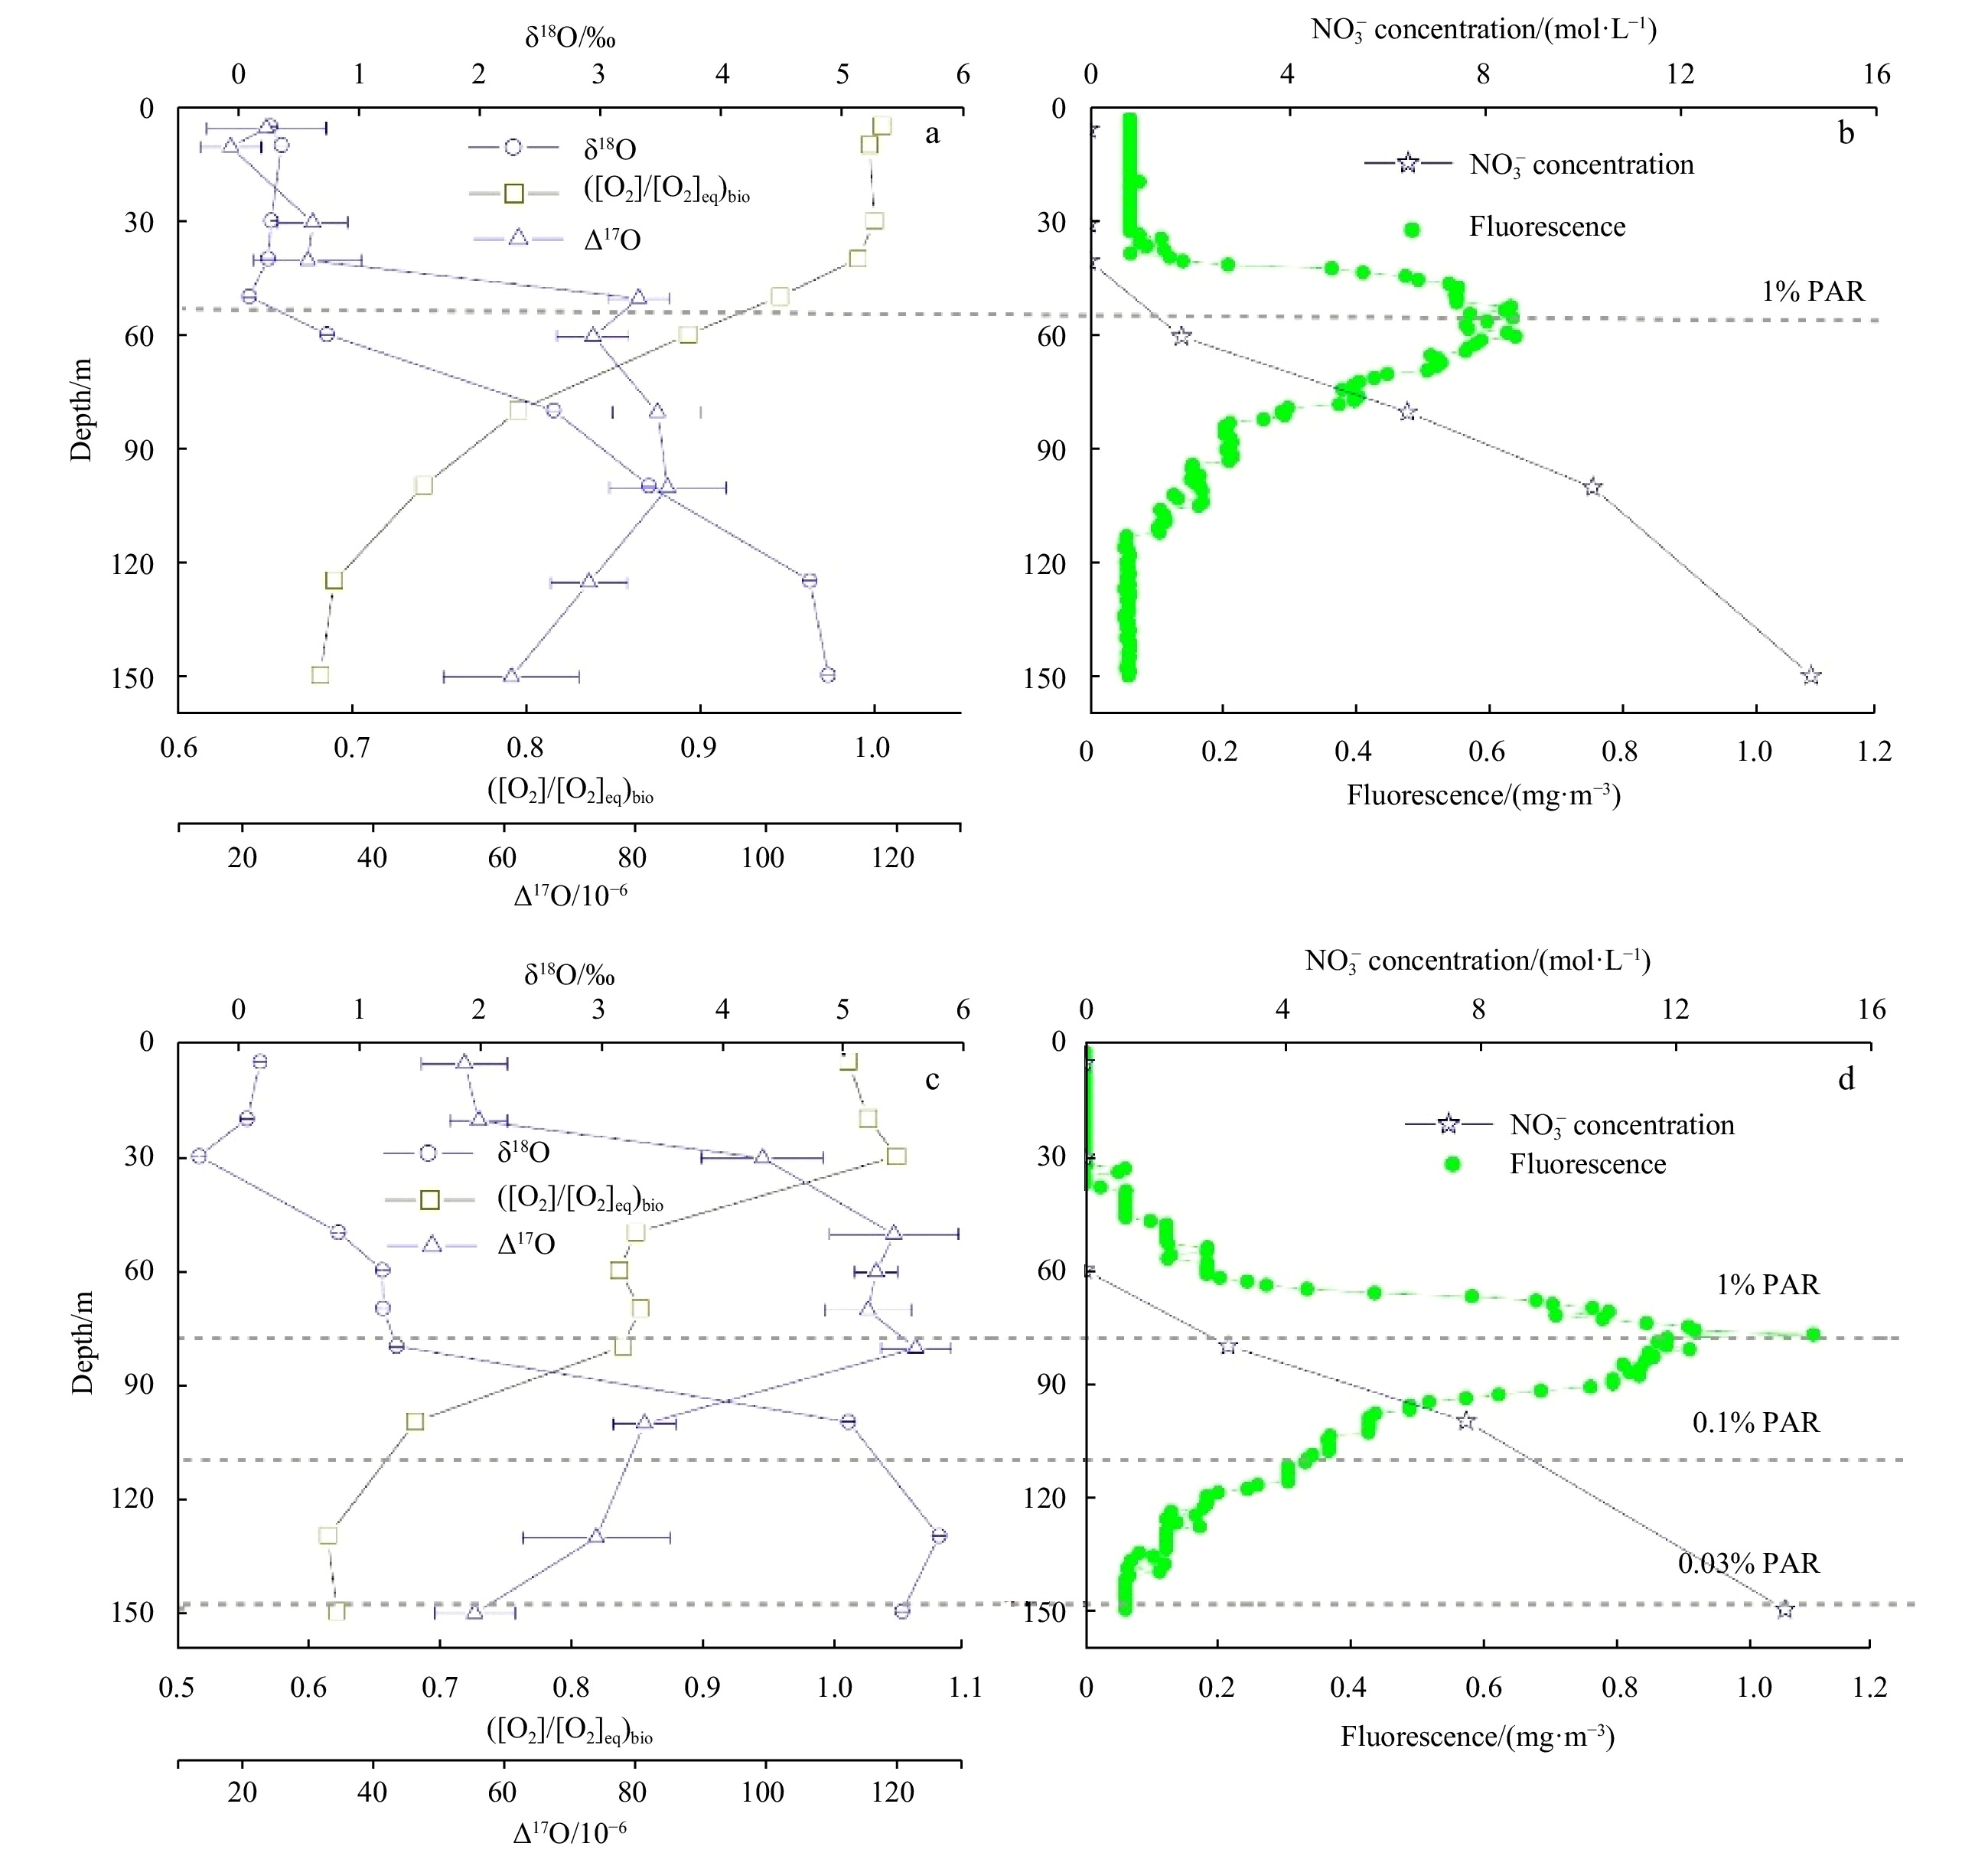
Figure 6. O2 properties (δ18O, ([O2]/[O2]eq)bio, and Δ17O in per meg),
${{\rm {NO}}_3^-} $ concentration (μmol/L), and fluorescence signal at Station L07 in October 2014 (a, b) and June 2015 (c, d). The illumination condition is shown by dashed lines, PAR represents photosynthetic active radiation.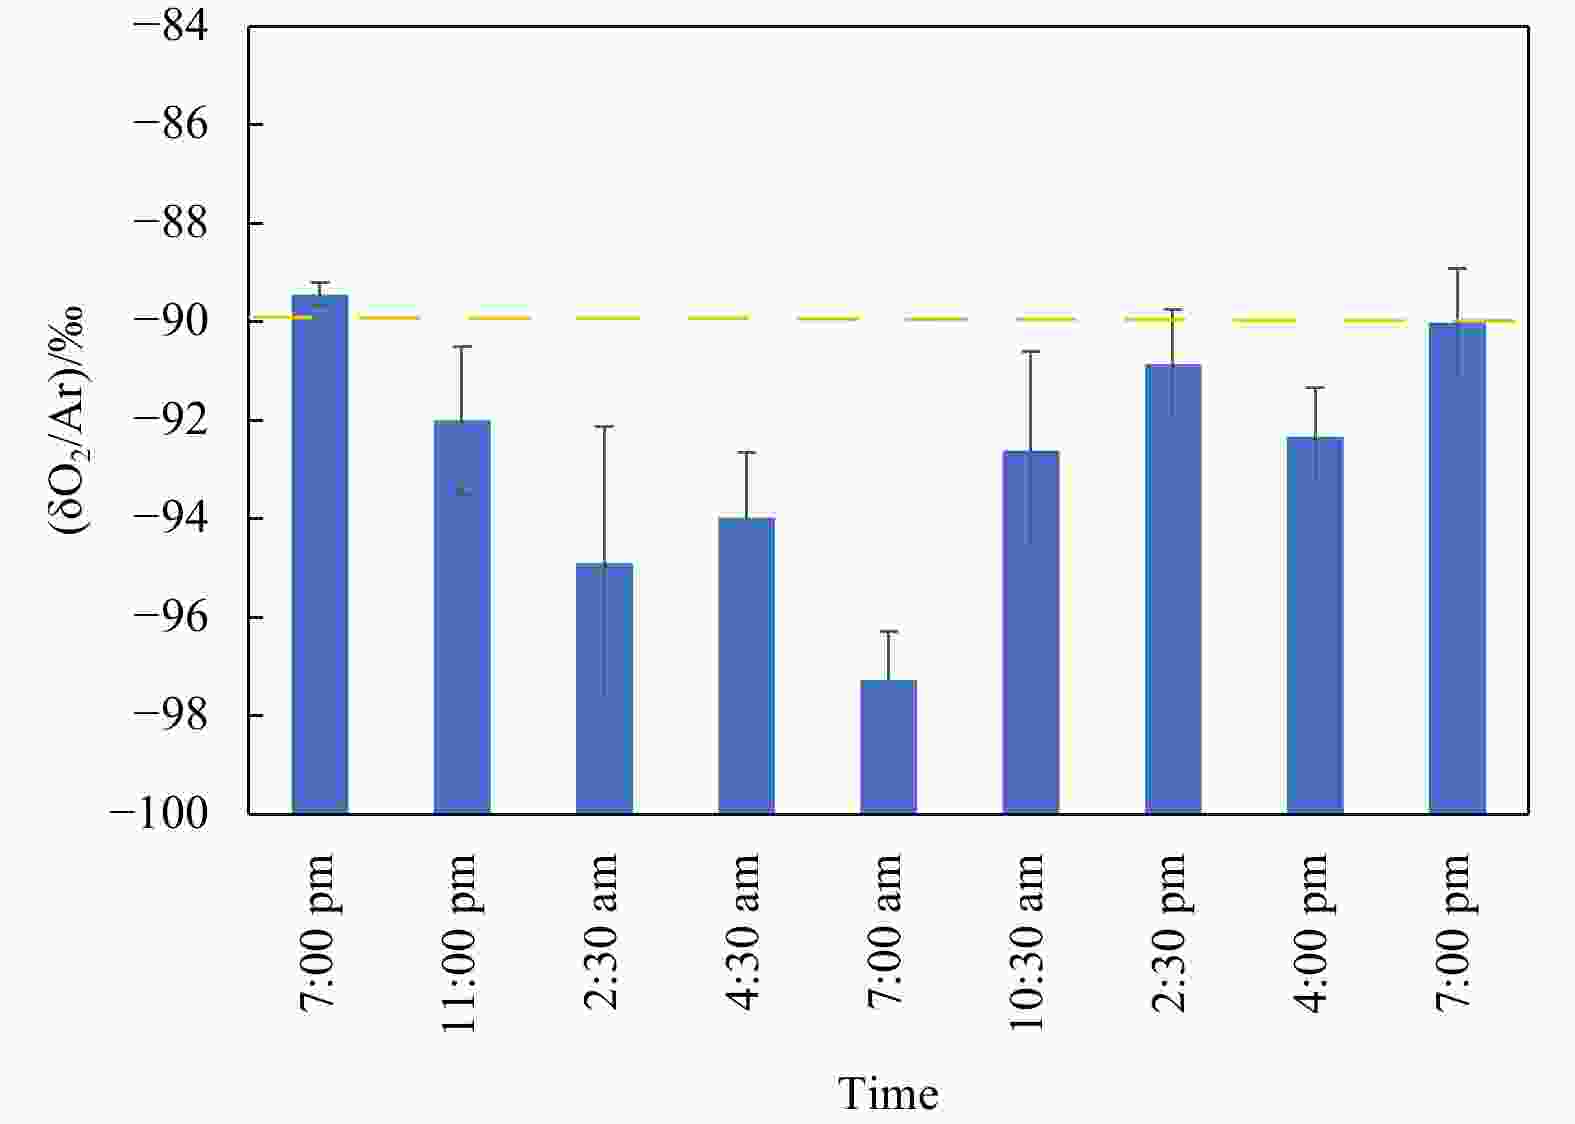
Figure 7. δO2/Ar values plotted against time at 5 m depth of the time series station. Note that the x axis is disproportional.

A1. Sea level anomaly (m) on October 13, 2014 (a) and June 15, 2015 (b) in this study. Note that both plots share the same contour range and color scale. Star indicates Station L07. Sea level anomaly data downloaded from https://las.aviso.altimetry.fr/las/.
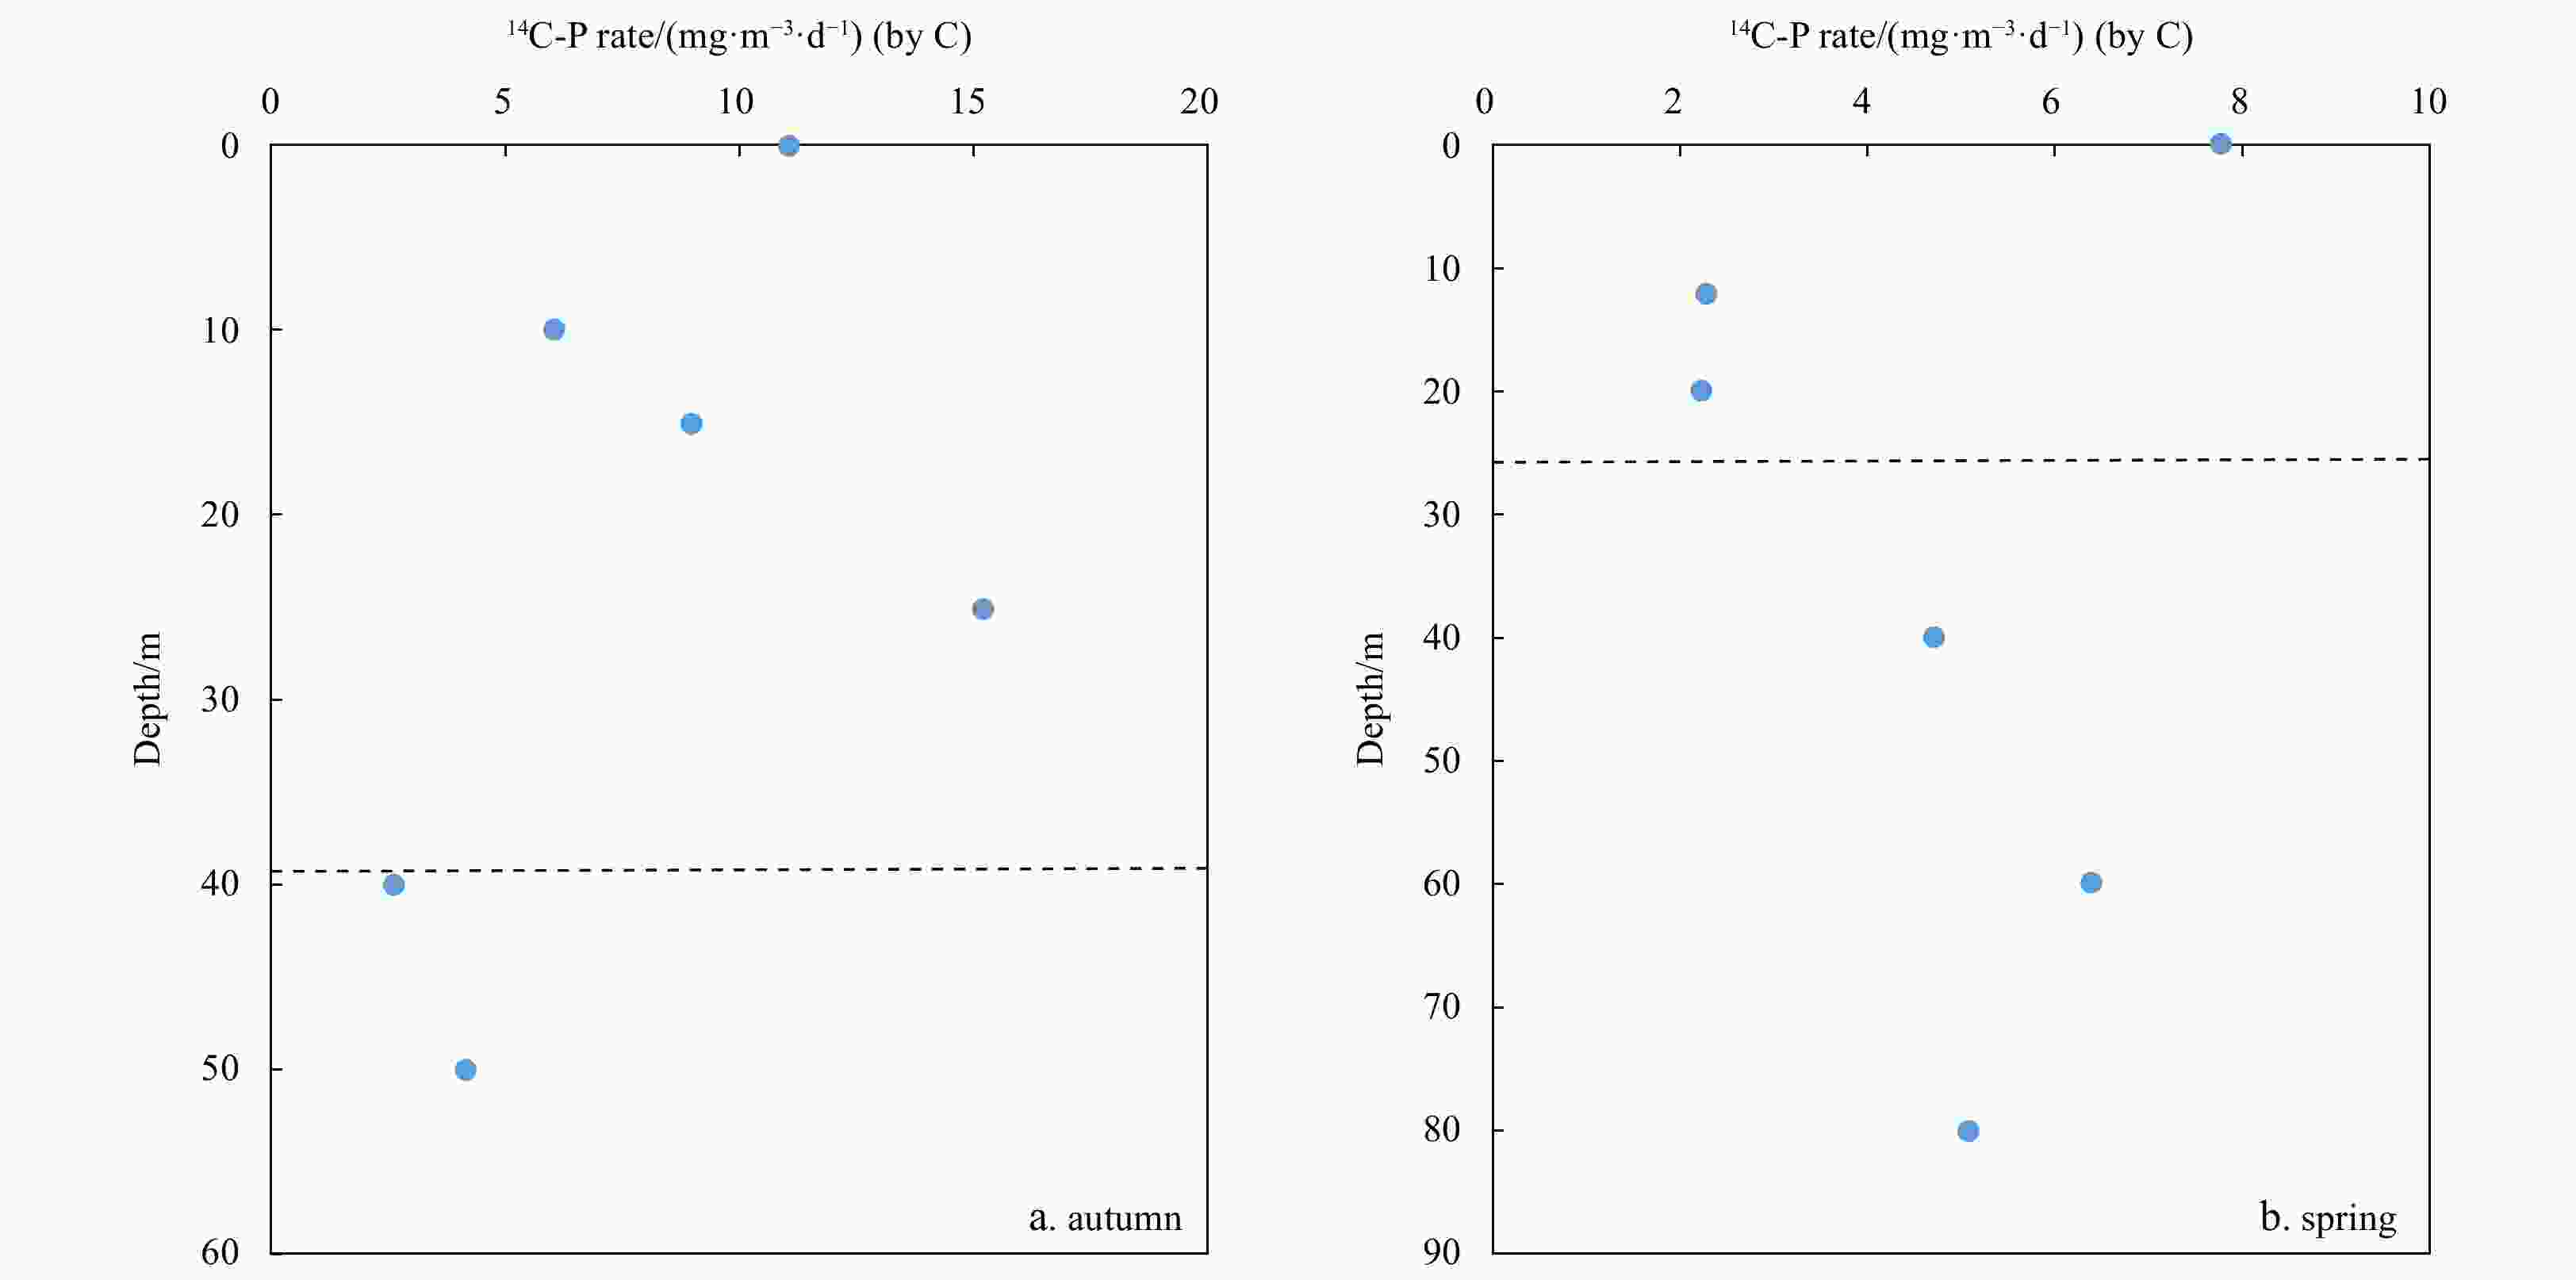
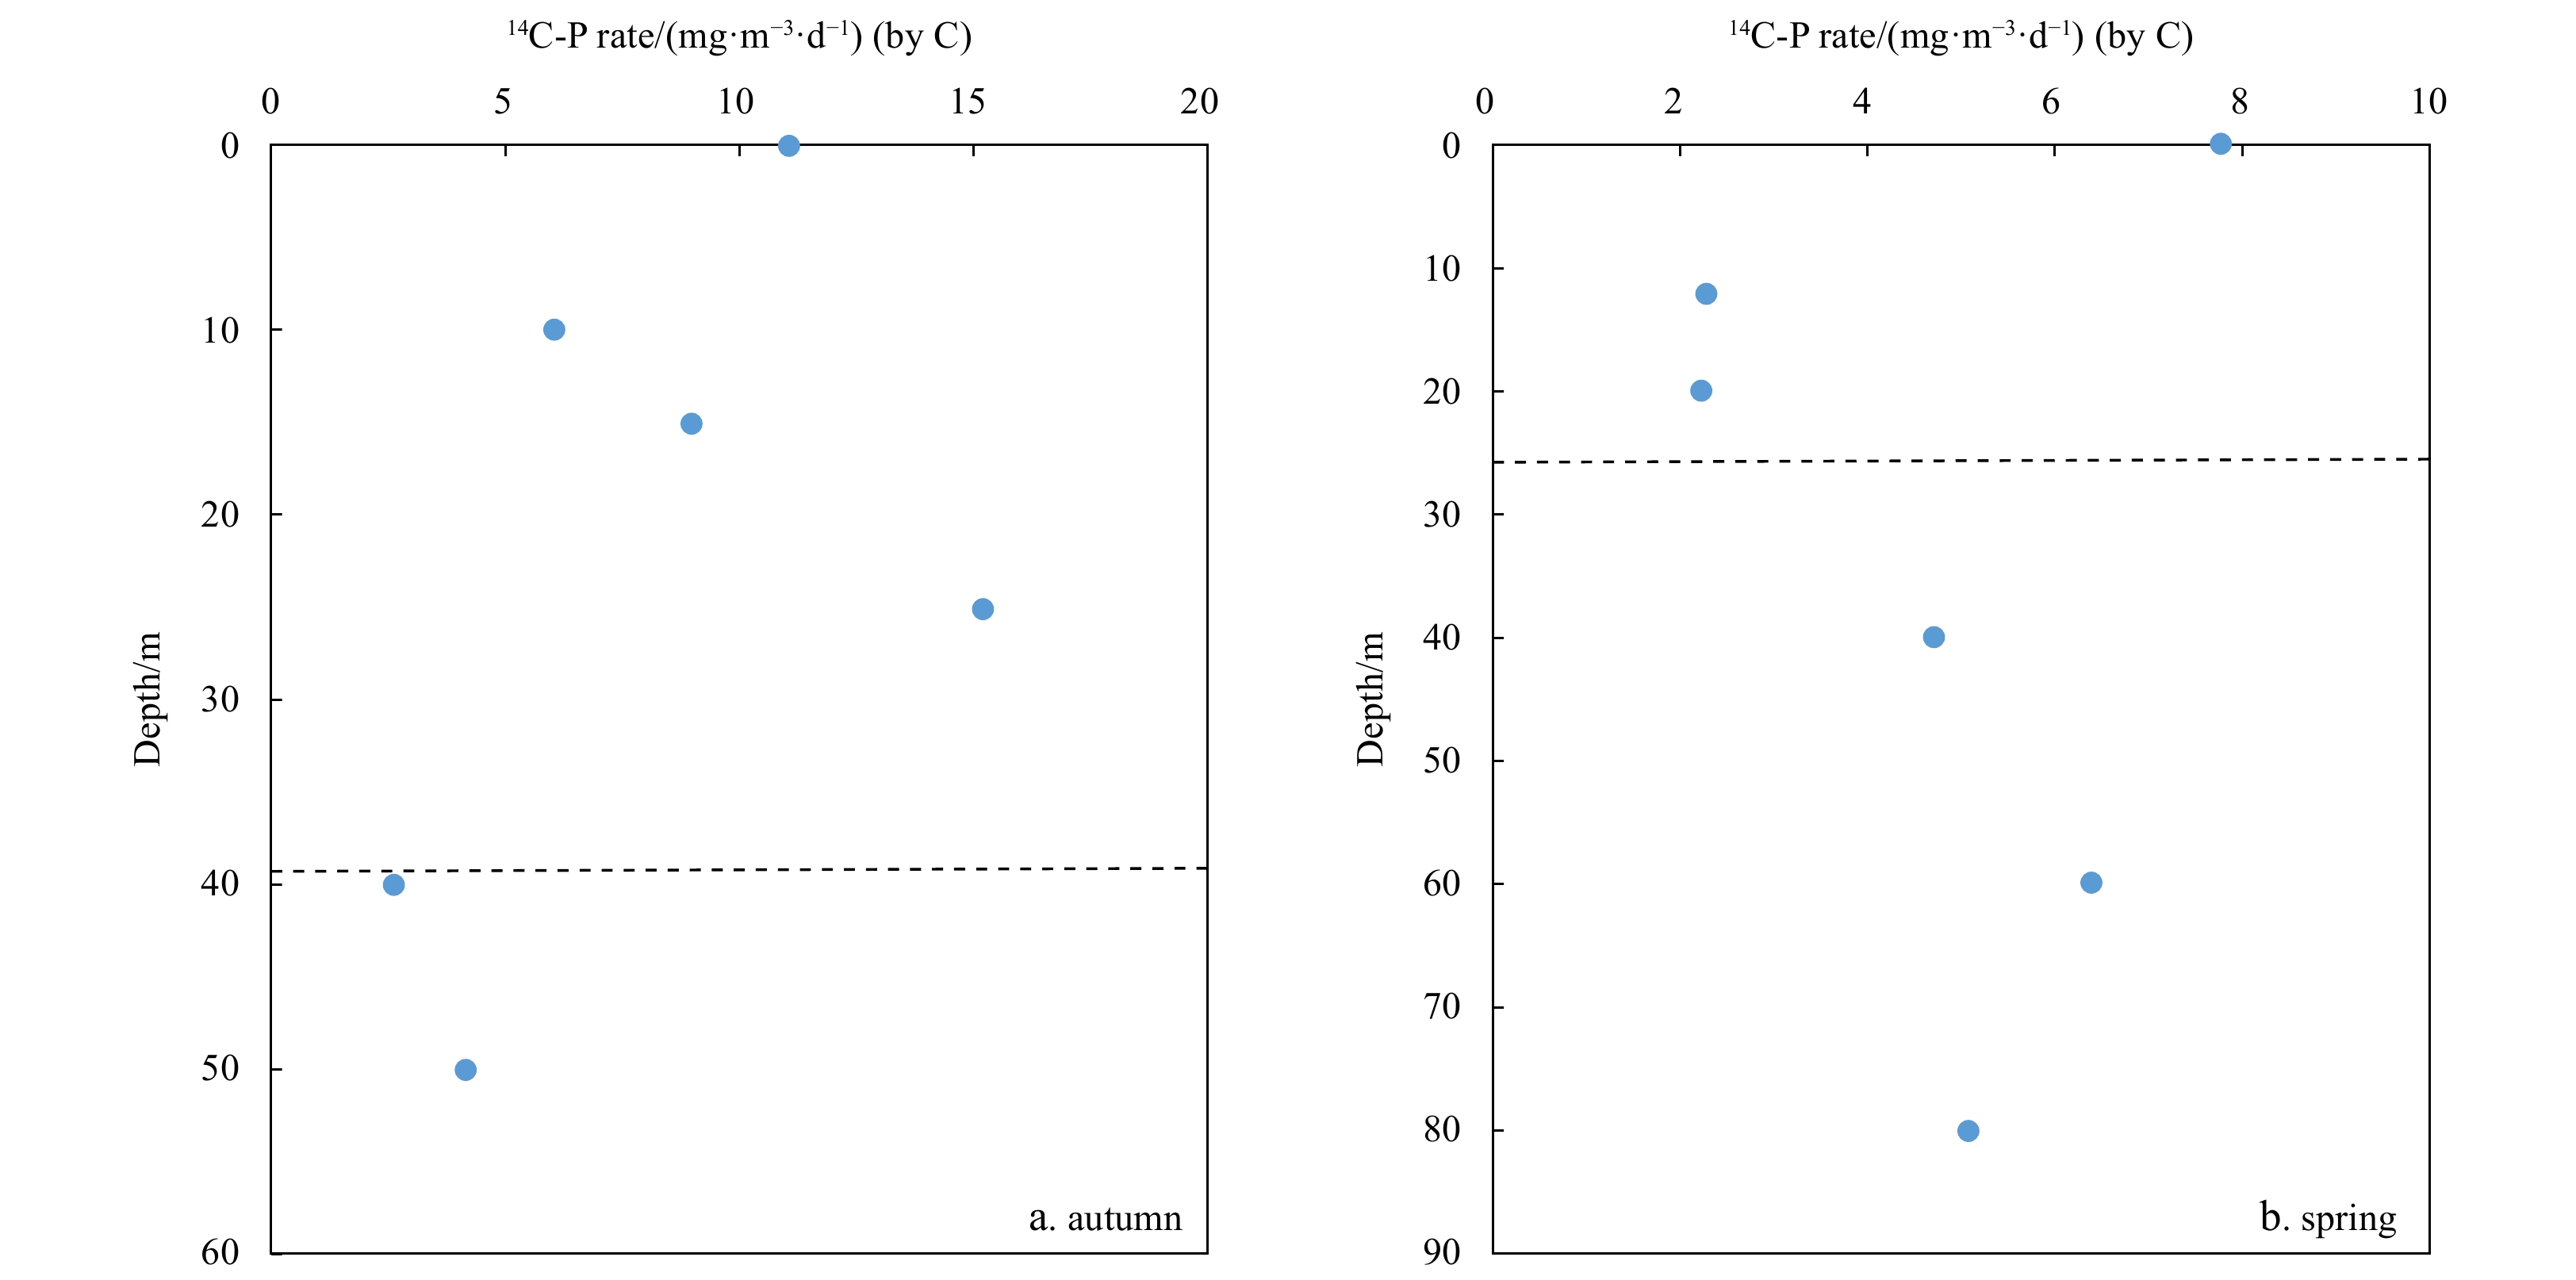
A2. 14C-P rate versus depth within the euphotic zone in autumn (Station L07, mixed layer depth of 39.5 m) and spring (Station L05, mixed layer depth of 27 m). The dashed line indicates the bottom of mixed layer.
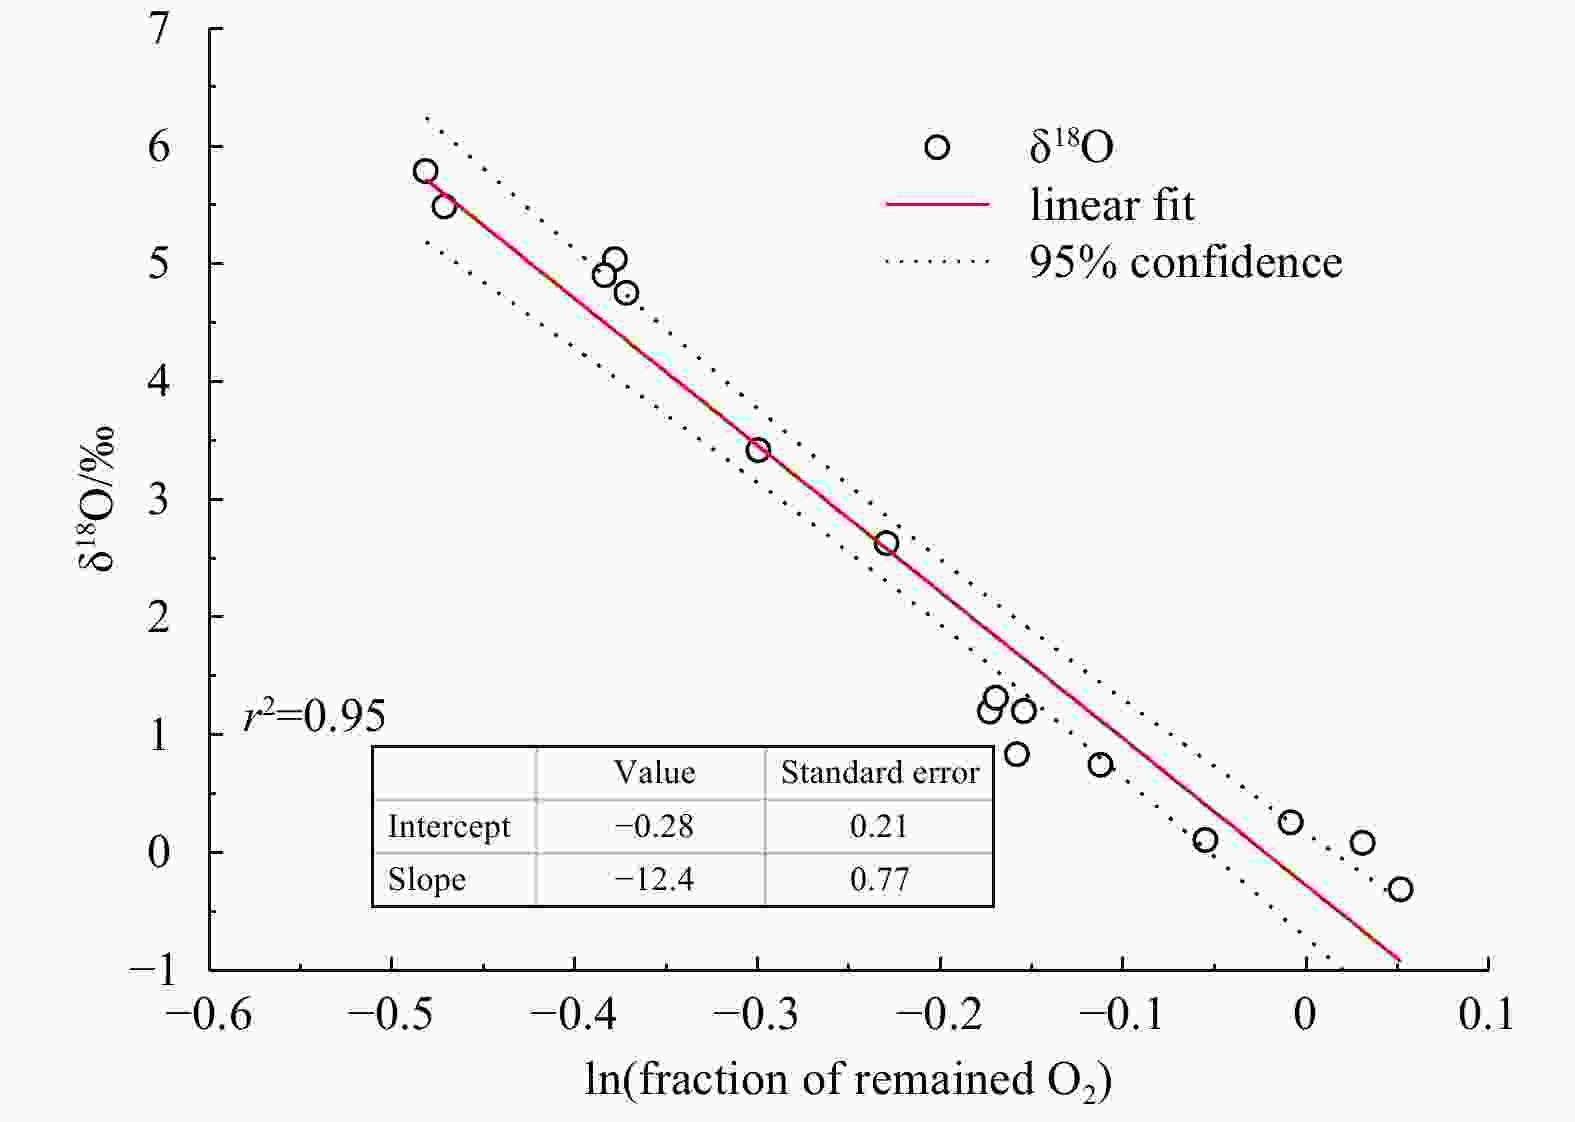
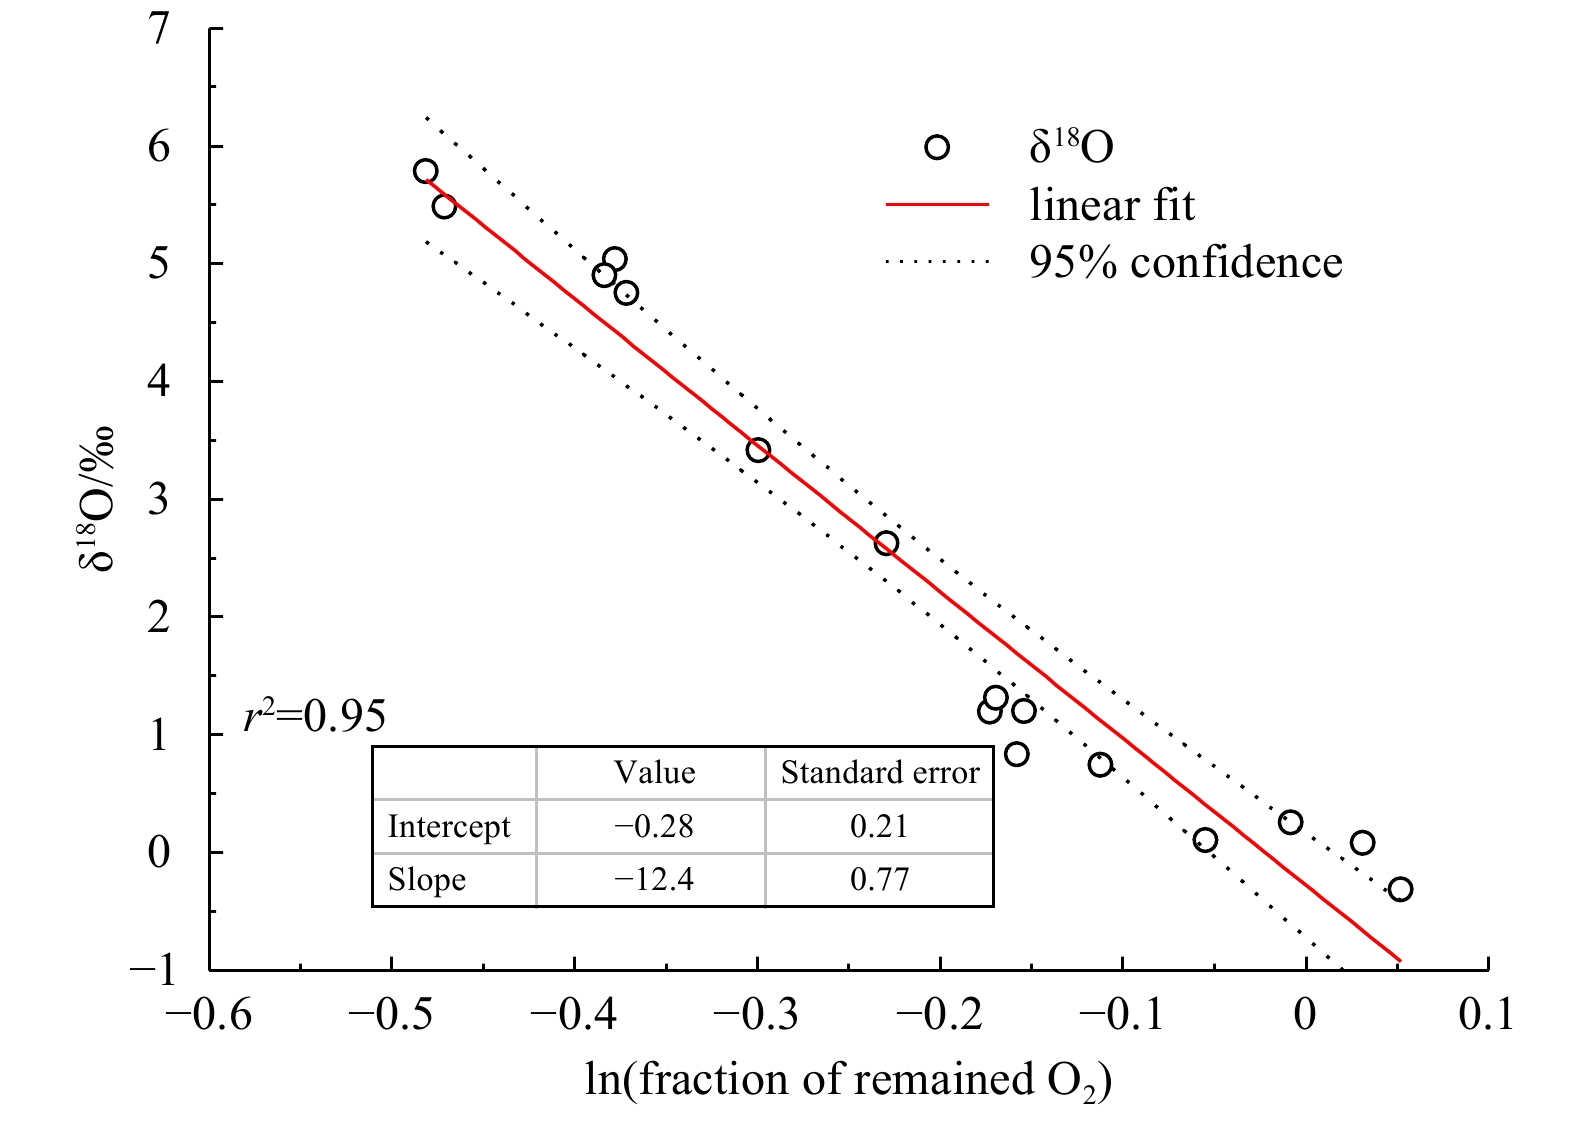
A3. δ18O plotted against [O2] (as ln(fraction of remained O2)) in this study for both spring and autumn samples beneath the mixed layer.
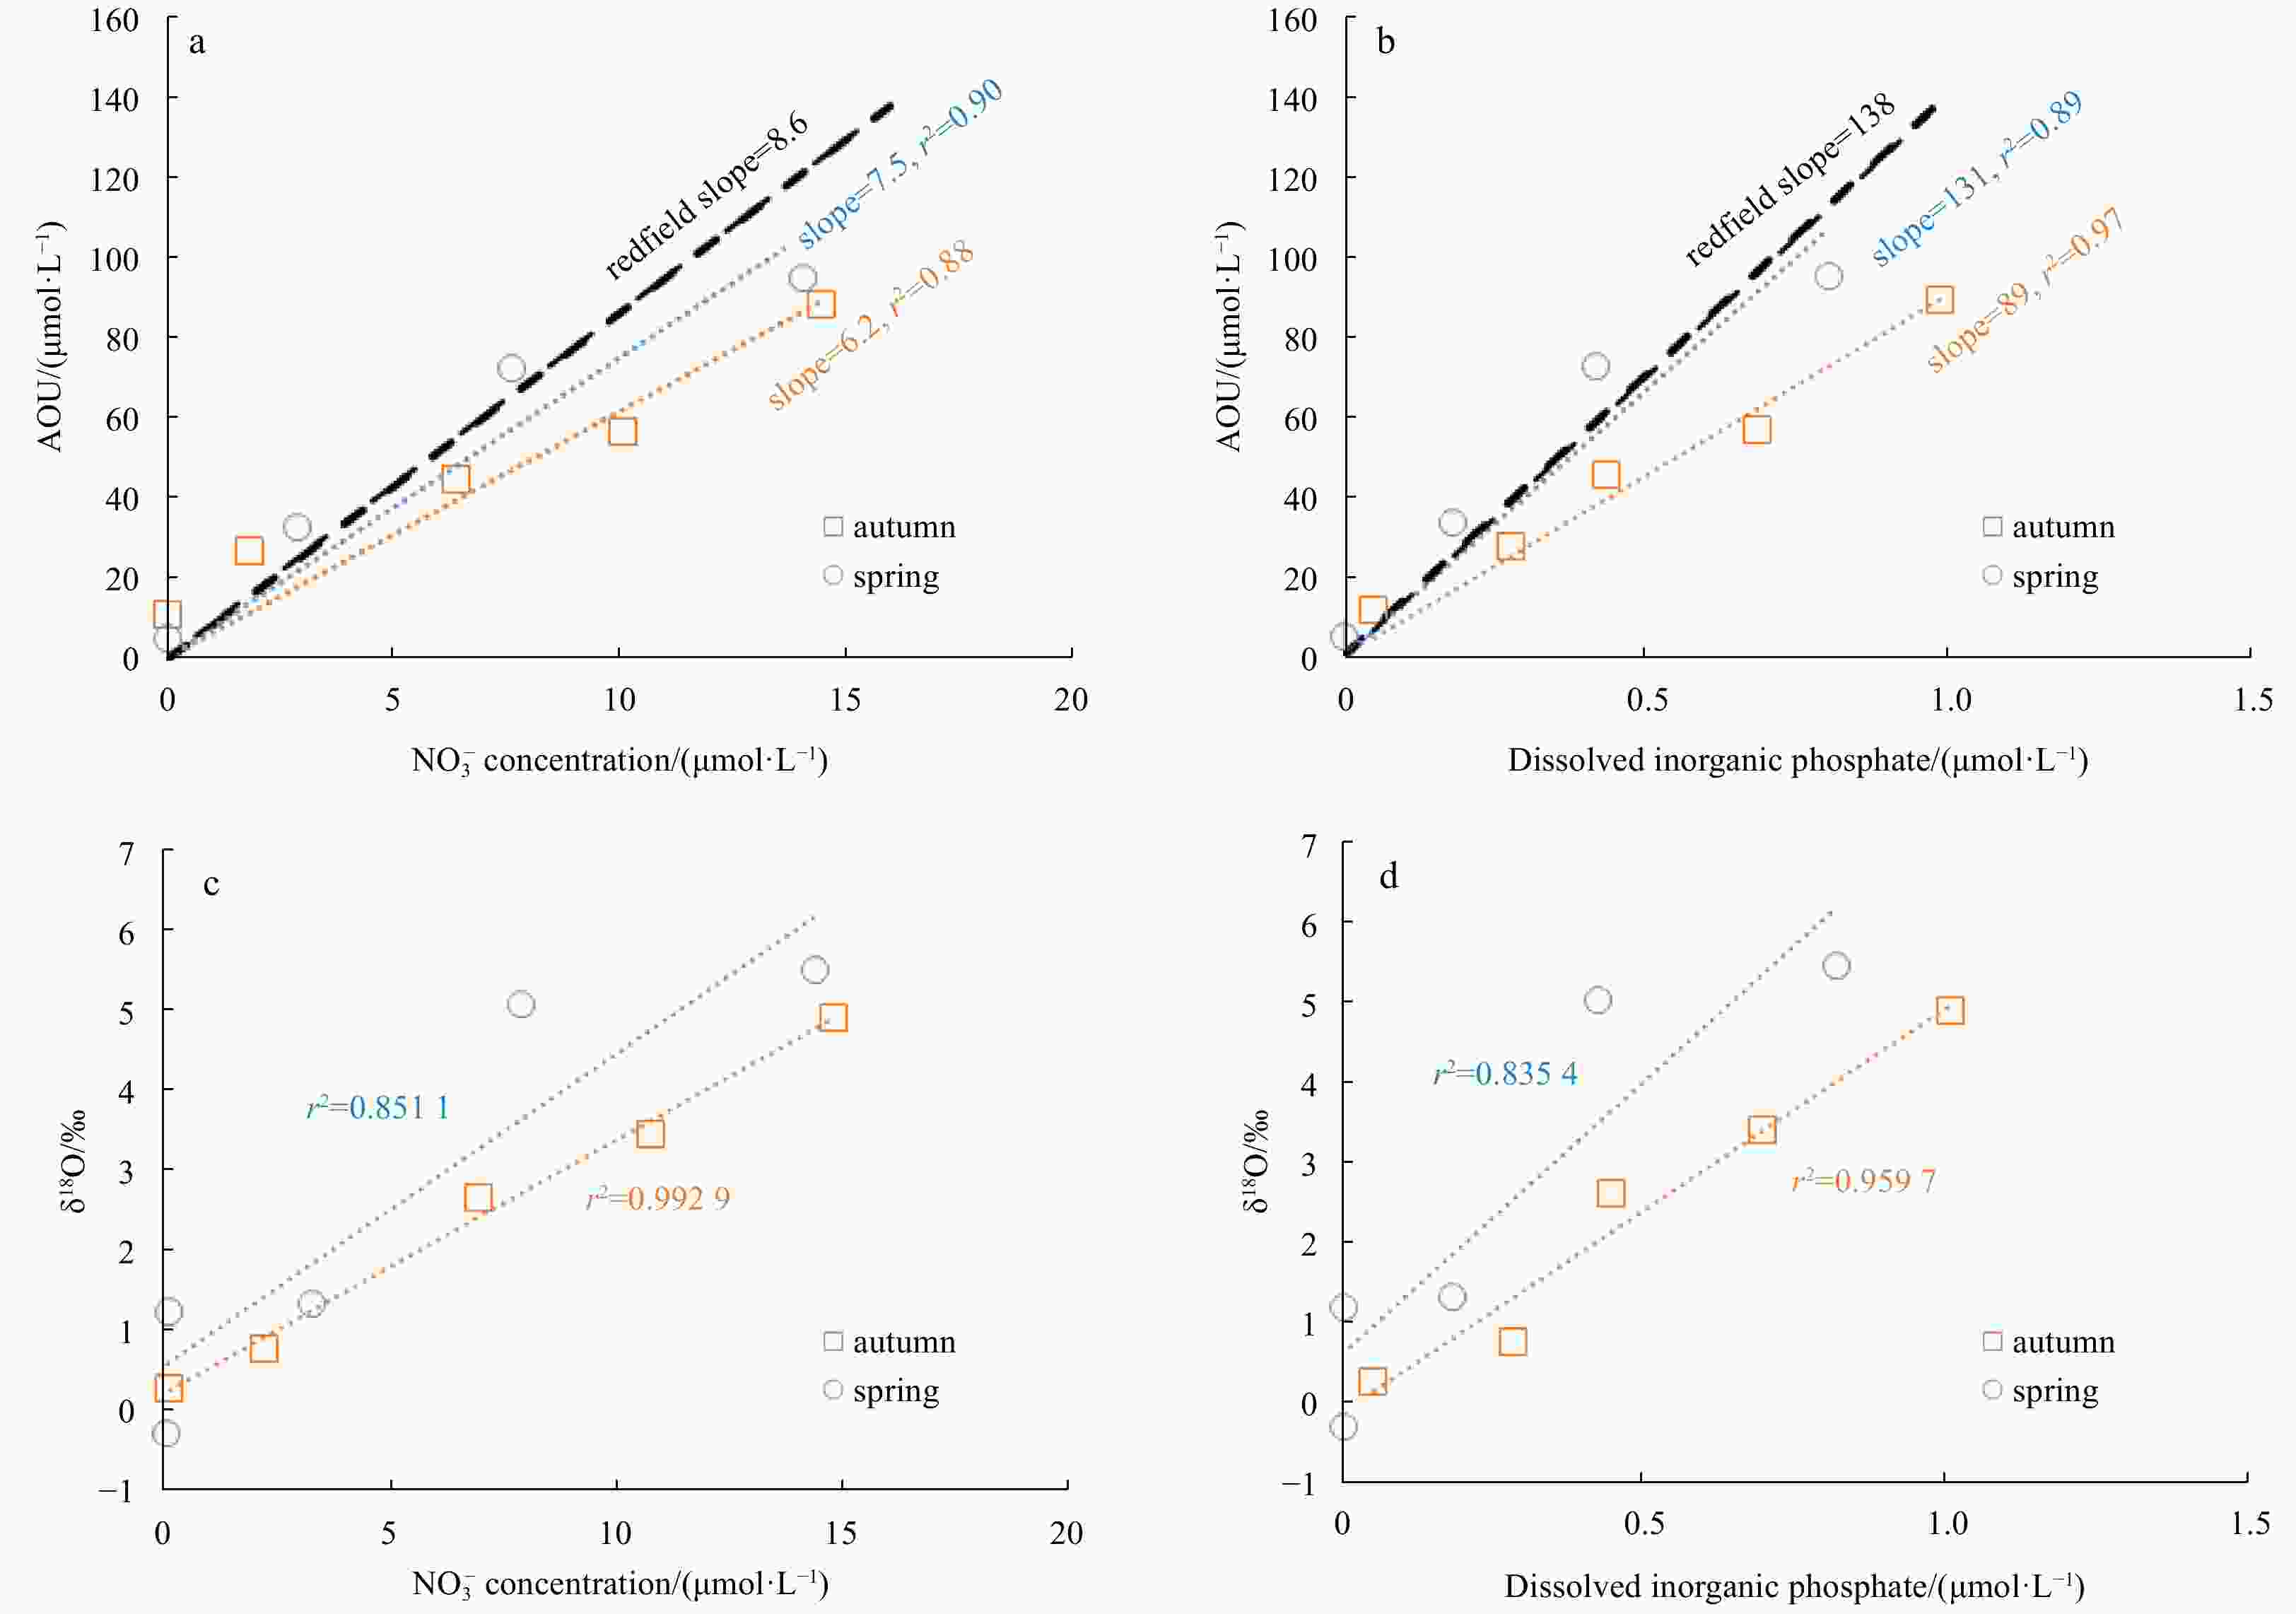
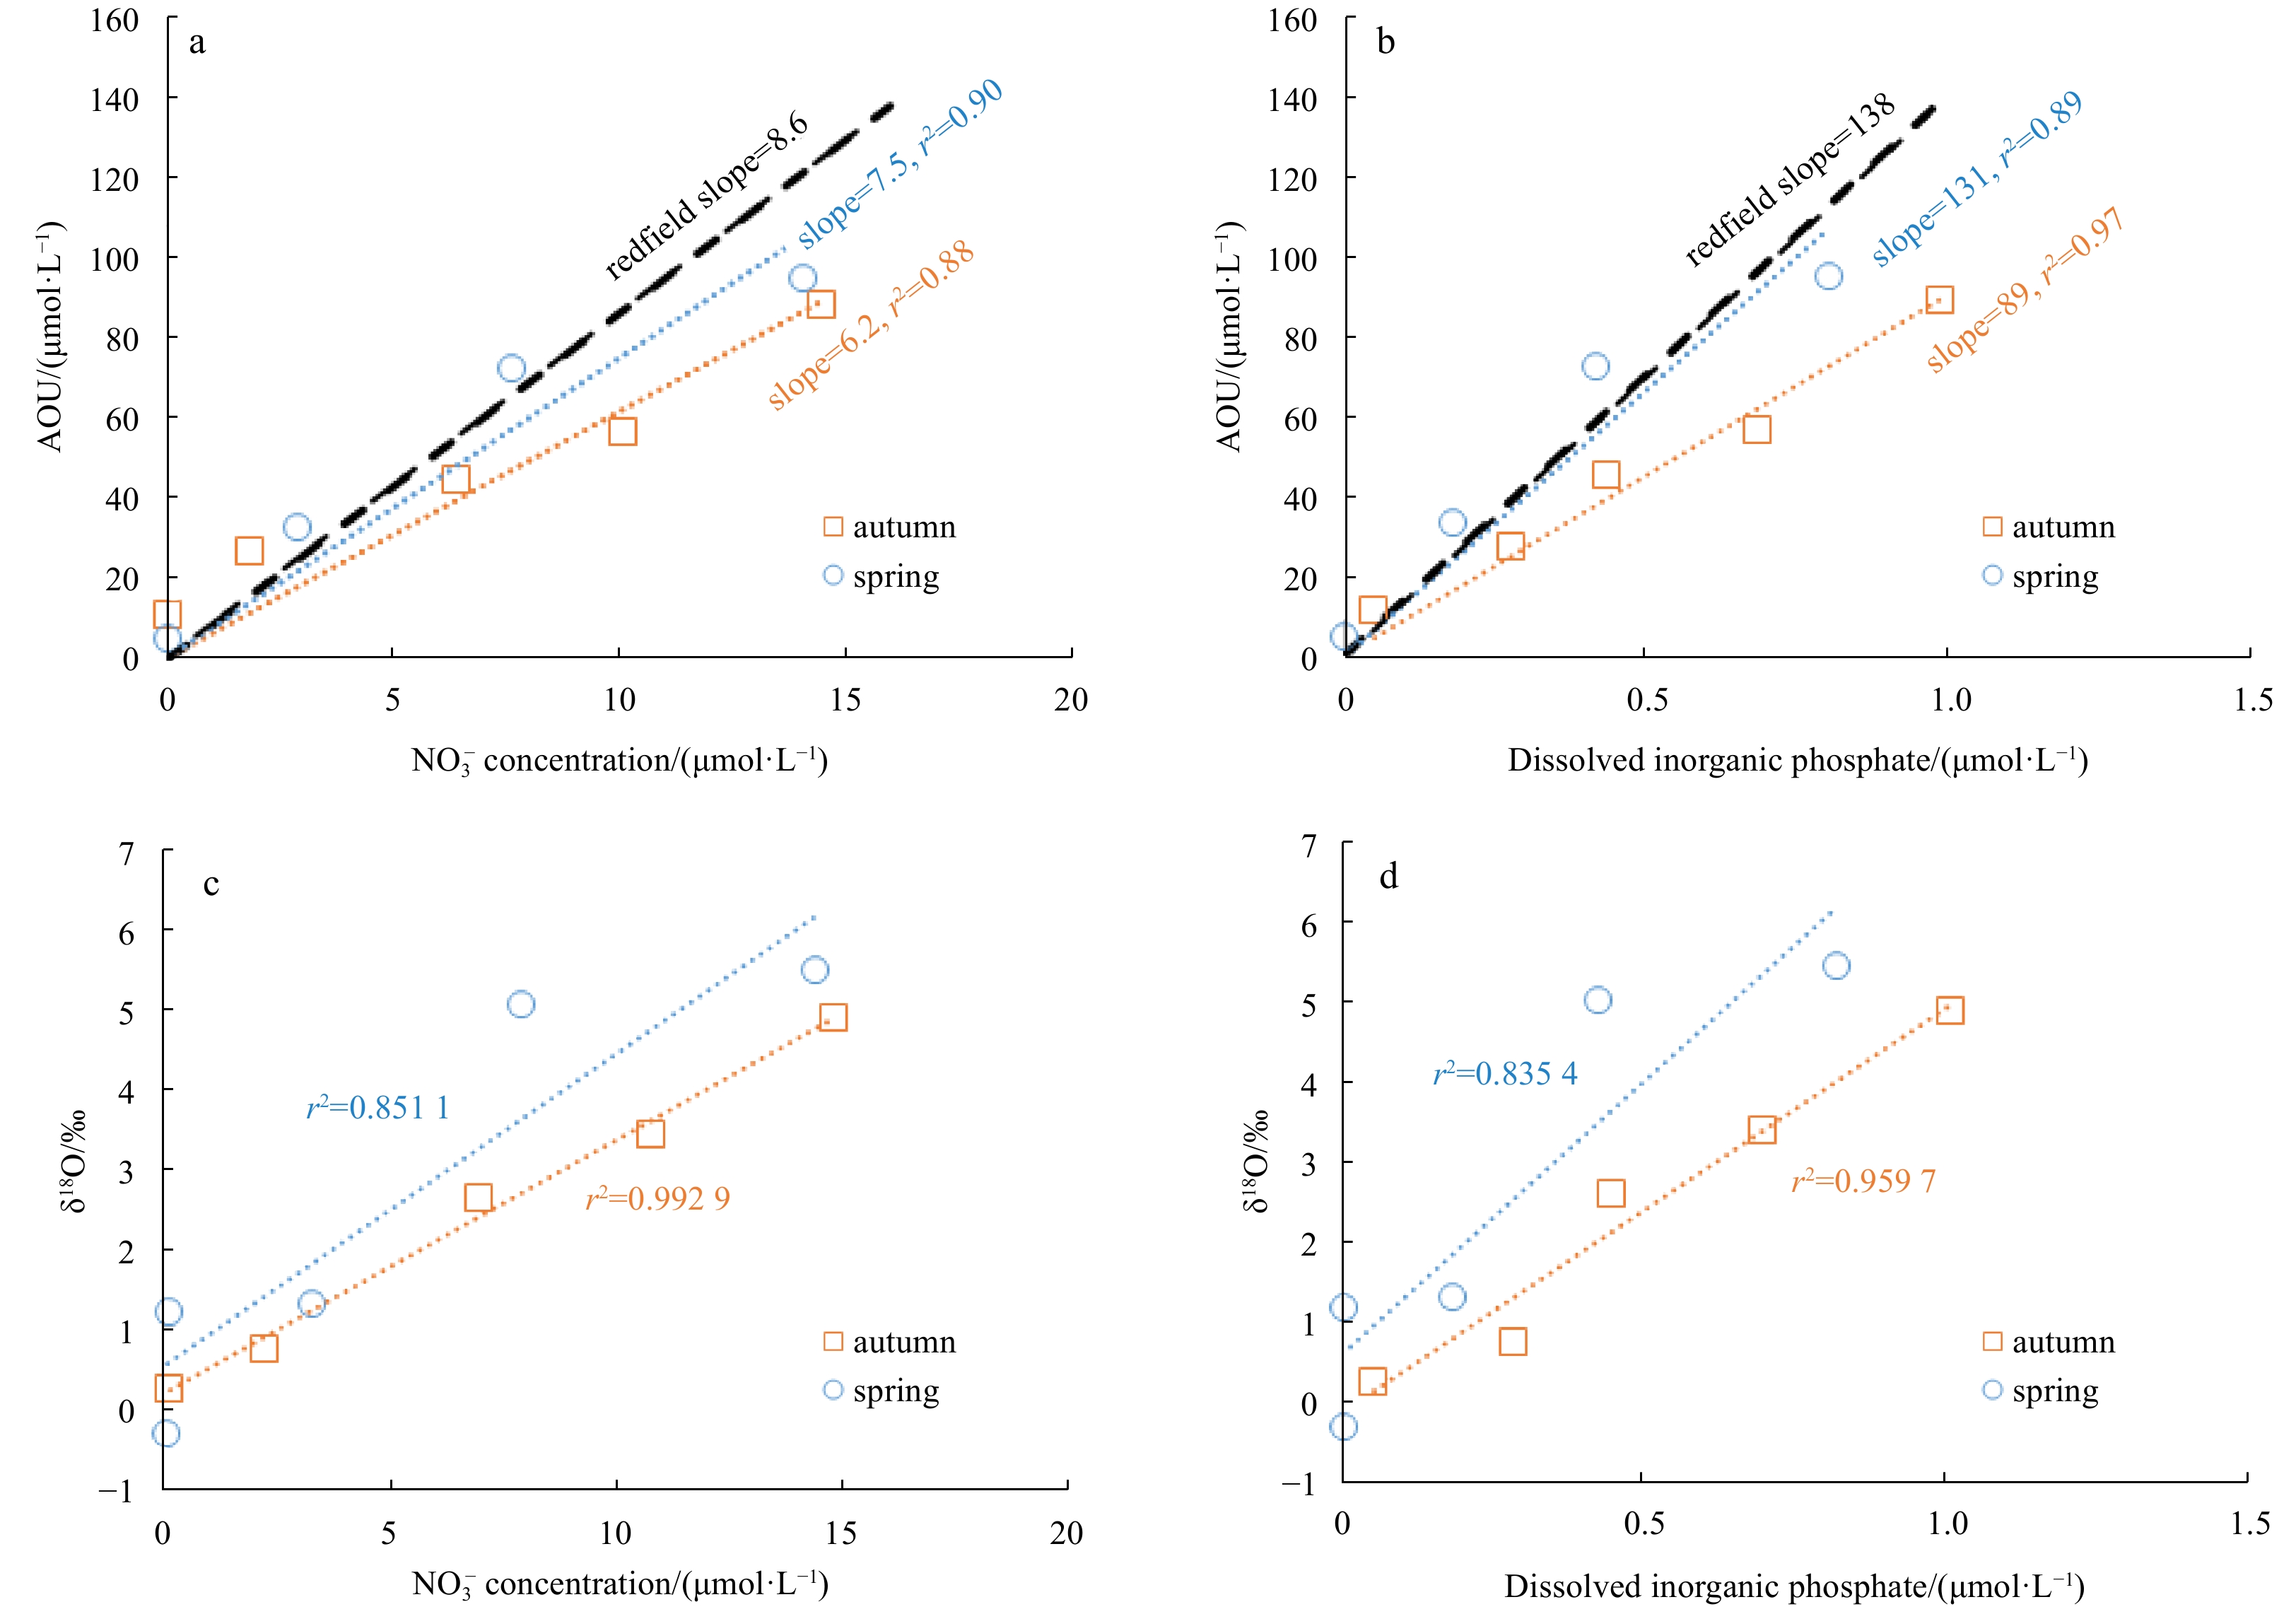
A4. Nutrients plotted against O2 properties in the depths where oxygen is depleted (i.e., ([O2]/[O2]eq)bio < 1). AOV, apparent oxygen utilization.
Table 1. Main physical parameters in spring (June) and autumn (October) in the present study
Parameter Spring Autumn Mixed layer depth/m 21.5 39.5 k (time-dependent)*/(m·d–1) 2.524 7.485 k′ (time-independent)/(m·d–1) 2.285 7.509 SST/°C 30.208 26.957 Salinity 33.808 34.061 [O2]eq/(μmol·L–1) 195 205 ([O2]/[O2]eq)bio 1.0111 1.0009 GOP/(mmol·m–2·d–1) (by O2) 189±26 169±23 NOP/(mmol·m–2·d–1) (by O2) 8.2±1.1 1.5±0.7 GOP/14C-P – 5.4 Note: GOP, gross oxygen production; NOP, net oxygen production; k, pooled piston velocity; [O2] and [O2]eq represent the measured and equilibrated O2 concentration in the water, respectively; 14C-P represents 14C-based primary production; – represents no data; * this value was considered in the final GOP calculation.  下载: 导出CSV
Table 2. Pooled production rates for the SCS shelf/slope region and other subtropical regions
Date INP/(mmol·m–2·d–1) (by C) IPP/(mmol·m–2·d–1) (by C) Region Data Source Jul./Aug. 2006 – >75 – Song et al. (2012) Jul. 2003, Jun./Jul. 2004 5–14 68.0–72.5 SCS shelf and slope regions Chen and Chen (2006) Oct. 2002 2.5–18 12.5–51.0 SCS shelf region Chen (2005) May 2005 – 27 SCS basin region Zhang et al. (2018) Jun./Jul.1998 – 19 SCS basin region Ning et al. (2004) Oct. 2014 – 34 – present study Jun. 2015 – 31 – present study Oct. 2014 1.5±0.7 169±23 SCS slope region present study Jun. 2015 8.2±1.1 189±26 SCS slope region present study Aug. 2012 0–50 200 SCS slope region Wang et al. (2014) July – 270–376 SCS shelf edge Hung et al. (2020) Annual 10.7 – SCS basin Huang et al. (2018) Annual 14±4 50–240 subtropical Pacific Quay et al. (2010) Aug. to Sep. 2006 5.9±0.9 121±34 western equatorial Pacific Stanley et al. (2010) Annual 6–8.3 29–103 BAT Luz and Barkan (2009) Annual – 0–280 BAT Nicholson et al. (2012) Annual – 25–210 HOT Nicholson et al. (2012) Note: BAT, Bermuda Atlantic time series study; HOT, Hawaii Ocean time series study; INP, integrated net production; IPP, integrated primary production; SCS, South China Sea; –, no data.
下载: 导出CSV
-
[1] Bender M, Grande K, Johnson K, et al. 1987. A comparison of four methods for determining planktonic community production. Limnology and Oceanography, 32(5): 1085–1098. doi: 10.4319/lo.1987.32.5.1085 [2] Bender M L. 1990. The δ18O of dissolved O2 in seawater: A unique tracer of circulation and respiration in the deep sea. Journal of Geophysical Research: Oceans, 95(C12): 22243–22252. doi: 10.1029/JC095iC12p22243 [3] Bender M L. 2000. Tracer from the sky. Science, 288(5473): 1977–1978. doi: 10.1126/science.288.5473.1977 [4] Bender M L, Kinter S, Cassar N, et al. 2011. Evaluating gas transfer velocity parameterizations using upper ocean radon distributions. Journal of Geophysical Research: Oceans, 116(C2): C02010 [5] Blunier T, Barnett B, Bender M L, et al. 2002. Biological oxygen productivity during the last 60,000 years from triple oxygen isotope measurements. Global Biogeochemical Cycles, 16(3): 3–1–3–13 [6] Brewer P G, Peltzer E T. 2017. Depth perception: the need to report ocean biogeochemical rates as functions of temperature, not depth. Philosophical Transactions of the Royal Society A: Mathematical. Physical and Engineering Sciences, 375(2102): 20160319 [7] Cassar N, Nevison C D, Manizza M. 2014. Correcting oceanic O2/Ar-net community production estimates for vertical mixing using N2O observations. Geophysical Research Letters, 41(24): 8961–8970. doi: 10.1002/2014GL062040 [8] Chen Y l L. 2005. Spatial and seasonal variations of nitrate-based new production and primary production in the South China Sea. Deep Sea Research Part I: Oceanographic Research Papers, 52(2): 319–340. doi: 10.1016/j.dsr.2004.11.001 [9] Chen Y l L, Chen H Y. 2006. Seasonal dynamics of primary and new production in the northern South China Sea: The significance of river discharge and nutrient advection. Deep Sea Research Part I: Oceanographic Research Papers, 53(6): 971–986. doi: 10.1016/j.dsr.2006.02.005 [10] Chen Y l L, Chen H Y, Tuo S H, et al. 2008. Seasonal dynamics of new production from Trichodesmium N2 fixation and nitrate uptake in the upstream Kuroshio and South China Sea basin. Limnology and Oceanography, 53(5): 1705–1721. doi: 10.4319/lo.2008.53.5.1705 [11] Chen Zhongwei, Yang Chenghao, Xu Dongfeng, et al. 2016. Observed hydrographical features and circulation with influences of cyclonic-anticyclonic eddy-pair in the northern slope of the South China Sea during June 2015. Journal of Marine Sciences (in Chinese), 34(4): 10–19 [12] Garcia H E, Gordon L I. 1992. Oxygen solubility in seawater: Better fitting equations. Limnology and Oceanography, 37(6): 1307–1312 [13] Haskell II W Z, Prokopenko M G, Hammond D E, et al. 2017. Annual cyclicity in export efficiency in the inner Southern California Bight. Global Biogeochemical Cycles, 31(2): 357–376 [14] Hendricks M B, Bender M L, Barnett B A. 2004. Net and gross O2 production in the southern ocean from measurements of biological O2 saturation and its triple isotope composition. Deep Sea Research Part I: Oceanographic Research Papers, 51(11): 1541–1561. doi: 10.1016/j.dsr.2004.06.006 [15] Hendricks M B, Bender M L, Barnett B A, et al. 2005. Triple oxygen isotope composition of dissolved O2 in the equatorial Pacific: A tracer of mixing, production, and respiration. Journal of Geophysical Research: Oceans, 110(C12): C12021. doi: 10.1029/2004JC002735 [16] Huang Yibin, Yang Bo, Chen Bingzhang, et al. 2018. Net community production in the South China Sea Basin estimated from in situ O2 measurements on an Argo profiling float. Deep Sea Research Part I: Oceanographic Research Papers, 131: 54–61. doi: 10.1016/j.dsr.2017.11.002 [17] Hung J J, Wang Y J, Tseng C M, et al. 2020. Controlling mechanisms and cross linkages of ecosystem metabolism and atmospheric CO2 flux in the northern South China Sea. Deep Sea Research Part I: Oceanographic Research Papers, 157: 103205. doi: 10.1016/j.dsr.2019.103205 [18] Izett R W, Manning C C, Hamme R C, et al. 2018. Refined estimates of net community production in the subarctic Northeast Pacific derived from ΔO2/Ar measurements with N2O-based corrections for vertical mixing. Global Biogeochemical Cycles, 32(3): 326–350. doi: 10.1002/2017GB005792 [19] Juranek L W, Quay P D. 2013. Using triple isotopes of dissolved oxygen to evaluate global marine productivity. Annual Review of Marine Science, 5: 503–524. doi: 10.1146/annurev-marine-121211-172430 [20] Kiddon J, Bender M L, Orchardo J, et al. 1993. Isotopic fractionation of oxygen by respiring marine organisms. Global Biogeochemical Cycles, 7(3): 679–694. doi: 10.1029/93GB01444 [21] Knap A H, Michaels A, Close A R, et al. 1996. Protocols for the Joint Global Ocean Flux Study (JGOFS) core measurements. JGOFS Report No. 19. Paris, France: UNESCO [22] Laws E A, Landry M R, Barber R T, et al. 2000. Carbon cycling in primary production bottle incubations: inferences from grazing experiments and photosynthetic studies using 14C and 18O in the Arabian Sea. Deep Sea Research Part II: Topical Studies in Oceanography, 47(7–8): 1339–1352. doi: 10.1016/S0967-0645(99)00146-0 [23] Li Teng, Bai Yan, He Xianqiang, et al. 2018. The relationship between poc export efficiency and primary production: opposite on the shelf and basin of the northern South China Sea. Sustainability, 10(10): 3634. doi: 10.3390/su10103634 [24] Li Qina, Guo Xianghui, Zhai Weidong, et al. 2020. Partial pressure of CO2 and air-sea CO2 fluxes in the South China Sea: Synthesis of an 18-year dataset. Progress in Oceanography, 182: 102272. doi: 10.1016/j.pocean.2020.102272 [25] Liu K K, Chao S Y, Shaw P T, et al. 2002. Monsoon-forced chlorophyll distribution and primary production in the South China Sea: observations and a numerical study. Deep Sea Research Part I: Oceanographic Research Papers, 49(8): 1387–1412. doi: 10.1016/S0967-0637(02)00035-3 [26] Liu Y, Yu L, Chen G. 2020. Eddy-induced heat flux in the South China Sea. Figshare. http://dx.doi.org/10.6084/m9.figshare.11949735.v2 [2020-05-06] [27] Liu Zhiqiang, Gan Jianping. 2017. Three-dimensional pathways of water masses in the South China Sea: a modeling study. Journal of Geophysical Research: Oceans, 122(7): 6039–6054. doi: 10.1002/2016JC012511 [28] Luz B, Barkan E. 2000. Assessment of oceanic productivity with the triple-isotope composition of dissolved oxygen. Science, 288(5473): 2028–2031. doi: 10.1126/science.288.5473.2028 [29] Luz B, Barkan E. 2005. The isotopic ratios 17O/16O and 18O/16O in molecular oxygen and their significance in biogeochemistry. Geochimica et Cosmochimica Acta, 69(5): 1099–1110. doi: 10.1016/j.gca.2004.09.001 [30] Luz B, Barkan E. 2009. Net and gross oxygen production from O2/Ar, 17O/16O and 18O/16O ratios. Aquatic Microbial Ecology, 56: 133–145. doi: 10.3354/ame01296 [31] Mahadevan A, Thomas L N, Tandon A. 2008. Comment on “Eddy/wind interactions stimulate extraordinary mid-ocean plankton blooms”. Science, 320(5875): 448 [32] Mariotti A, Germon J C, Hubert P, et al. 1981. Experimental determination of nitrogen kinetic isotope fractionation: some principles; illustration for the denitrification and nitrification processes. Plant and Soil, 62(3): 413–430. doi: 10.1007/BF02374138 [33] Marra J. 2002. Approaches to the measurement of plankton production. In: Williams P J I B, Thomas D R, Reynolds C S, eds. Phytoplankton Productivity: Carbon Assimilation in Marine and Freshwater Ecosystems. Oxford: Blackwell, 78–108 [34] Miller M F. 2002. Isotopic fractionation and the quantification of 17O anomalies in the oxygen three-isotope system: an appraisal and geochemical significance. Geochimica et Cosmochimica Acta, 66(11): 1881–1889. doi: 10.1016/S0016-7037(02)00832-3 [35] Munro D R, Quay P D, Juranek L W, et al. 2013. Biological production rates off the Southern California coast estimated from triple O2 isotopes and O2: Ar gas ratios. Limnology and Oceanography, 58(4): 1312–1328. doi: 10.4319/lo.2013.58.4.1312 [36] Nicholson D P, Stanley R H R, Barkan E, et al. 2012. Evaluating triple oxygen isotope estimates of gross primary production at the Hawaii Ocean time-series and Bermuda Atlantic time-series study sites. Journal of Geophysical Research: Oceans, 117(C5): C05012 [37] Nicholson D, Stanley R H R, Doney S C. 2014. The triple oxygen isotope tracer of primary productivity in a dynamic ocean model. Global Biogeochemical Cycles, 28(5): 538–552. doi: 10.1002/2013GB004704 [38] Nielsen E S. 1952. The use of radio-active carbon (C14) for measuring organic production in the sea. ICES Journal of Marine Science, 18(2): 117–140. doi: 10.1093/icesjms/18.2.117 [39] Ning X R, Chai F, Xue H, et al. 2004. Physical-biological oceanographic coupling influencing phytoplankton and primary production in the South China Sea. Journal of Geophysical Research: Oceans, 109(C10): C10005. doi: 10.1029/2004JC002365 [40] Prokopenko M G, Pauluis O M, Granger J, et al. 2011. Exact evaluation of gross photosynthetic production from the oxygen triple-isotope composition of O2: Implications for the net-to-gross primary production ratios. Geophysical Research Letters, 38(14): L14603 [41] Quay P D, Emerson S, Wilbur D O, et al. 1993. The δ18O of dissolved O2 in the surface waters of the subarctic Pacific: a tracer of biological productivity. Journal of Geophysical Research: Oceans, 98(C5): 8447–8458. doi: 10.1029/92JC03017 [42] Quay P D, Peacock C, Björkman K, et al. 2010. Measuring primary production rates in the ocean: Enigmatic results between incubation and non-incubation methods at Station ALOHA. Global Biogeochemical Cycles, 24(3): GB3014 [43] Redfield A C, Ketchum B H, Richards F A. 1963. The influence of organisms on the composition of seawater. In: Hill M N, ed. The Sea. New York: John Wiley, 26–77 [44] Reuer M K, Barnett B A, Bender M L, et al. 2007. New estimates of Southern Ocean biological production rates from O2/Ar ratios and the triple isotope composition of O2. Deep Sea Research Part I: Oceanographic Research Papers, 54(6): 951–974. doi: 10.1016/j.dsr.2007.02.007 [45] Song Xingyu, Lai Zhigang, Ji Rubao, et al. 2012. Summertime primary production in northwest South China Sea: Interaction of coastal eddy, upwelling and biological processes. Continental Shelf Research, 48: 110–121. doi: 10.1016/j.csr.2012.07.016 [46] Stanley R H R, Doney S C, Jenkins W J, et al. 2012. Apparent oxygen utilization rates calculated from tritium and helium-3 profiles at the Bermuda Atlantic time-series study site. Biogeosciences, 9: 1969–1983. doi: 10.5194/bg-9-1969-2012 [47] Stanley R H R, Kirkpatrick J B, Cassar N, et al. 2010. Net community production and gross primary production rates in the western equatorial Pacific. Global Biogeochemical Cycles, 24(4): GB4001 [48] Sweeney C, Gloor E, Jacobson A R, et al. 2007. Constraining global air-sea gas exchange for CO2 with recent bomb 14C measurements. Global Biogeochemical Cycles, 21(2): GB2015 [49] Walsh J J. 1991. Importance of continental margins in the marine biogeochemical cycling of carbon and nitrogen. Nature, 350(6313): 53–55. doi: 10.1038/350053a0 [50] Wang Na, Lin Wei, Chen Bingzhang, et al. 2014. Metabolic states of the Taiwan Strait and the northern South China Sea in summer 2012. Journal of Tropical Oceanography (in Chinese), 33(4): 61–68 [51] Wanninkhof R. 1992. Relationship between wind speed and gas exchange over the ocean. Journal of Geophysical Research: Oceans, 97(C5): 7373–7382. doi: 10.1029/92JC00188 [52] Weiss R F, Price B A. 1980. Nitrous oxide solubility in water and seawater. Marine Chemistry, 8(4): 347–359. doi: 10.1016/0304-4203(80)90024-9 [53] Zhang Guiling, Liu Sumei, Casciotti K L, et al. 2019a. Distribution of concentration and stable isotopic composition of N2O in the shelf and slope of the Northern South China Sea: implications for production and emission. Journal of Geophysical Research: Oceans, 124(8): 6218–6234. doi: 10.1029/2019JC014947 [54] Zhang Yafeng, Wang Xutao, Yin Kedong. 2018. Spatial contrast in phytoplankton, bacteria and microzooplankton grazing between the eutrophic Yellow Sea and the oligotrophic South China Sea. Journal of Oceanology and Limnology, 36(1): 92–104. doi: 10.1007/s00343-018-6259-x [55] Zhang Miao, Wu Ying, Qi Lijun, et al. 2019b. Impact of the migration behavior of mesopelagic fishes on the compositions of dissolved and particulate organic carbon on the northern slope of the South China Sea. Deep Sea Research Part II: Topical Studies in Oceanography, 167: 46–54. doi: 10.1016/j.dsr2.2019.06.012 [56] Zhou Kuanbo, Dai Minhan, Kao S J, et al. 2013. Apparent enhancement of 234Th-based particle export associated with anticyclonic eddies. Earth and Planetary Science Letters, 381: 198–209. doi: 10.1016/j.jpgl.2013.07.039 -


 点击查看大图

计量
- 文章访问数: 497
- HTML全文浏览量: 137
- PDF下载量: 26
- 被引次数: 0

