

-
Abstract: The sea ice conditions in the Kara Sea have important impacts on Arctic shipping, oil and gas production, and marine environmental changes. In this study, sea ice coverage (CR) less than 30% is considered as open water, its onset and end dates are defined as Topen and Tclose, respectively. The sea ice melt onset (Tmelt) is defined as the date when ice-sea freshwater flux initially changes from ice into the ocean. Satellite-based sea ice concentration (SIC) from 1989 to 2019 shows a negative correlation between Topen and Tclose (r = –0.77, p < 0.01) in the Kara Sea. This phenomenon is also obtained through analyzing the hindcast simulation from 1994 to 2015 by a coupled ocean and sea-ice model (NAPA1/4). The model results reveal that thermodynamics dominate the sea ice variations, and ice basal melt is greater than the ice surface melt. Heat budget estimation suggests that the heat flux is significant correlated with Topen (r = –0.95, p < 0.01) during the melt period (the duration of multi-year averaged Tmelt to Topen) influenced by the sea ice conditions. Additionally, this heat flux is also suggested to dominate the interannual variation of the heat input during the whole heat absorption process (r = 0.81, p < 0.01). The more heat input during this process leads to later Tclose (r = 0.77, p < 0.01). This is the physical basis of the negative correlation between Topen and Tclose. Therefore, the duration of open water can be predicted by Topen and thence support earlier planning of marine activities.
-
Key words:
- sea ice /
- open water onset /
- duration of open water /
- heat budget /
- Kara Sea
-

Figure 1. Location and bathymetry of the Kara Sea (the topography data came from the ORCA025 developed for the DRAKKAR project,
https://www.drakkar-ocean.eu/global-models/orca025 ). The study region is bounded by three sections (thick black lines), Kara Gate (KG), Novaya Zemlya-Taymyr Peninsula (NT), Estuaries of Ob and Yenisei (ES).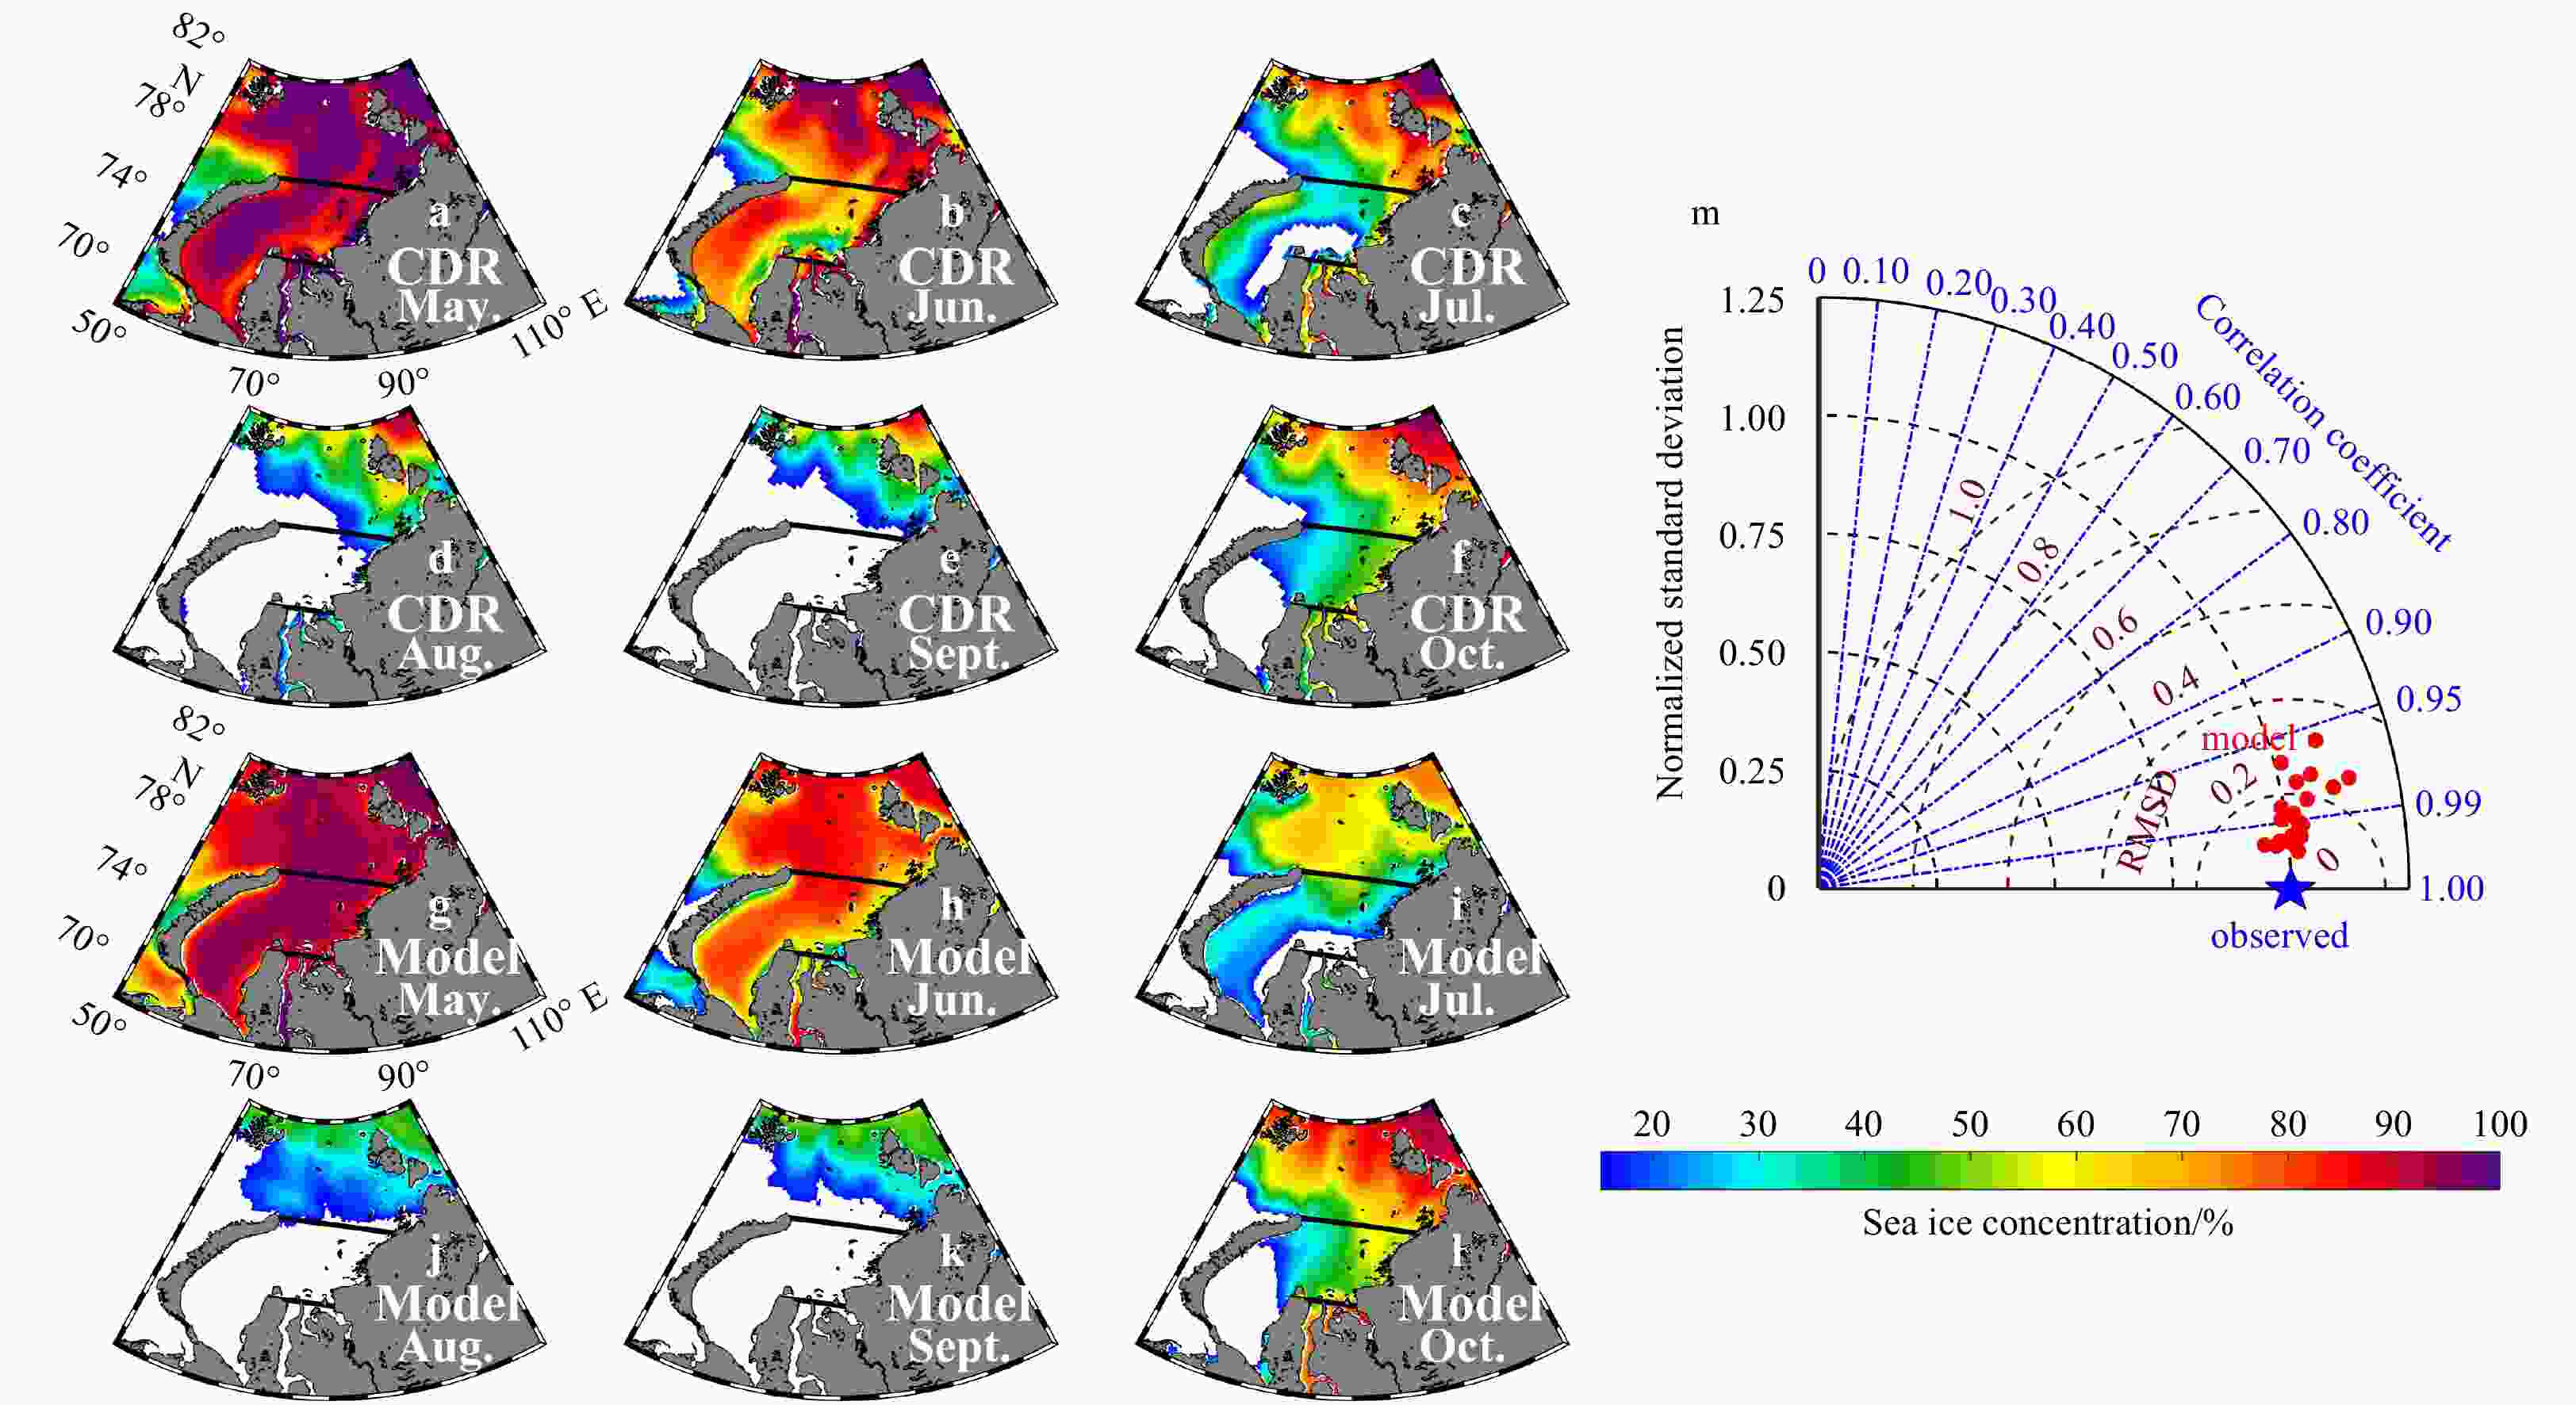
Figure 2. Spatial distributions of sea ice concentration from May to October from the CDR data set (a–f) and simulation results of NAPA1/4 (g–l), averaged over 1994–2015 in the Kara Sea; and the Taylor diagram showing normalized standard deviations (distant from the origin), correlations (azimuth angle), and bias removed RMS differences (Euclidian distance from the reference point) between NAPA 1/4 and the CDR data set (m). The reference point (blue star) applies to all satellite observed values. The red dots represent 5 d averaged time series in each year from 1994 to 2015.
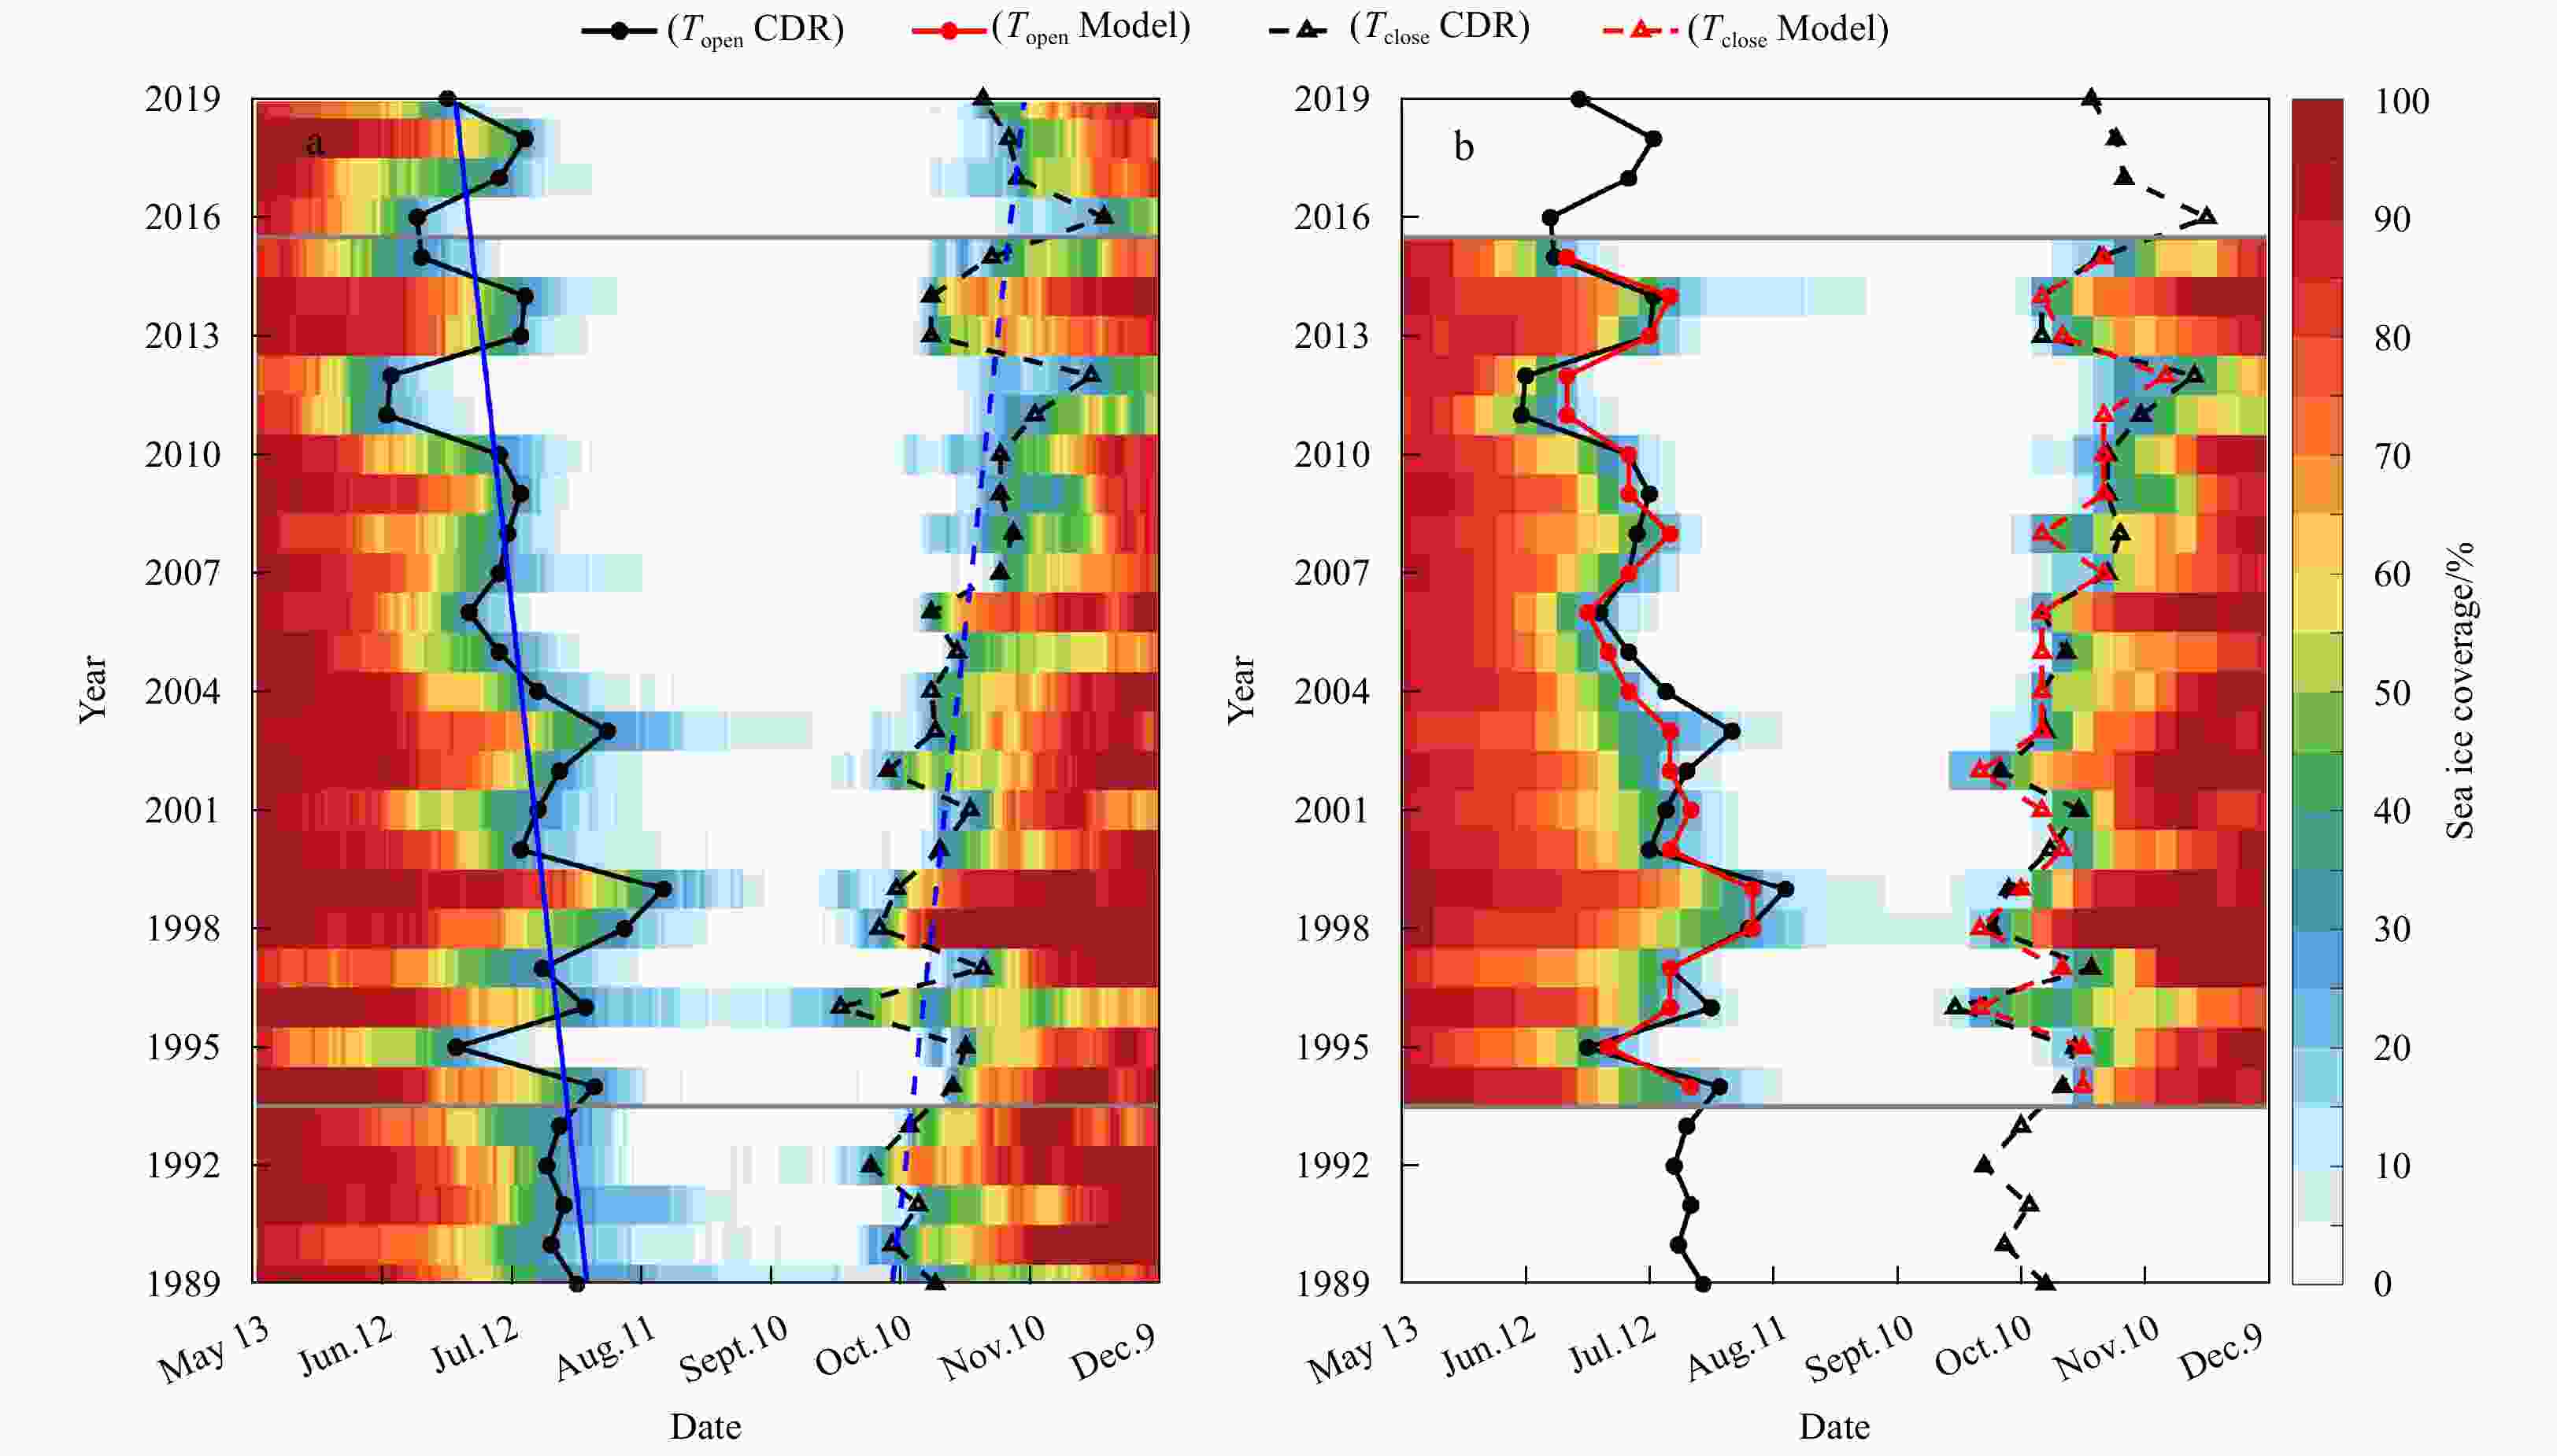
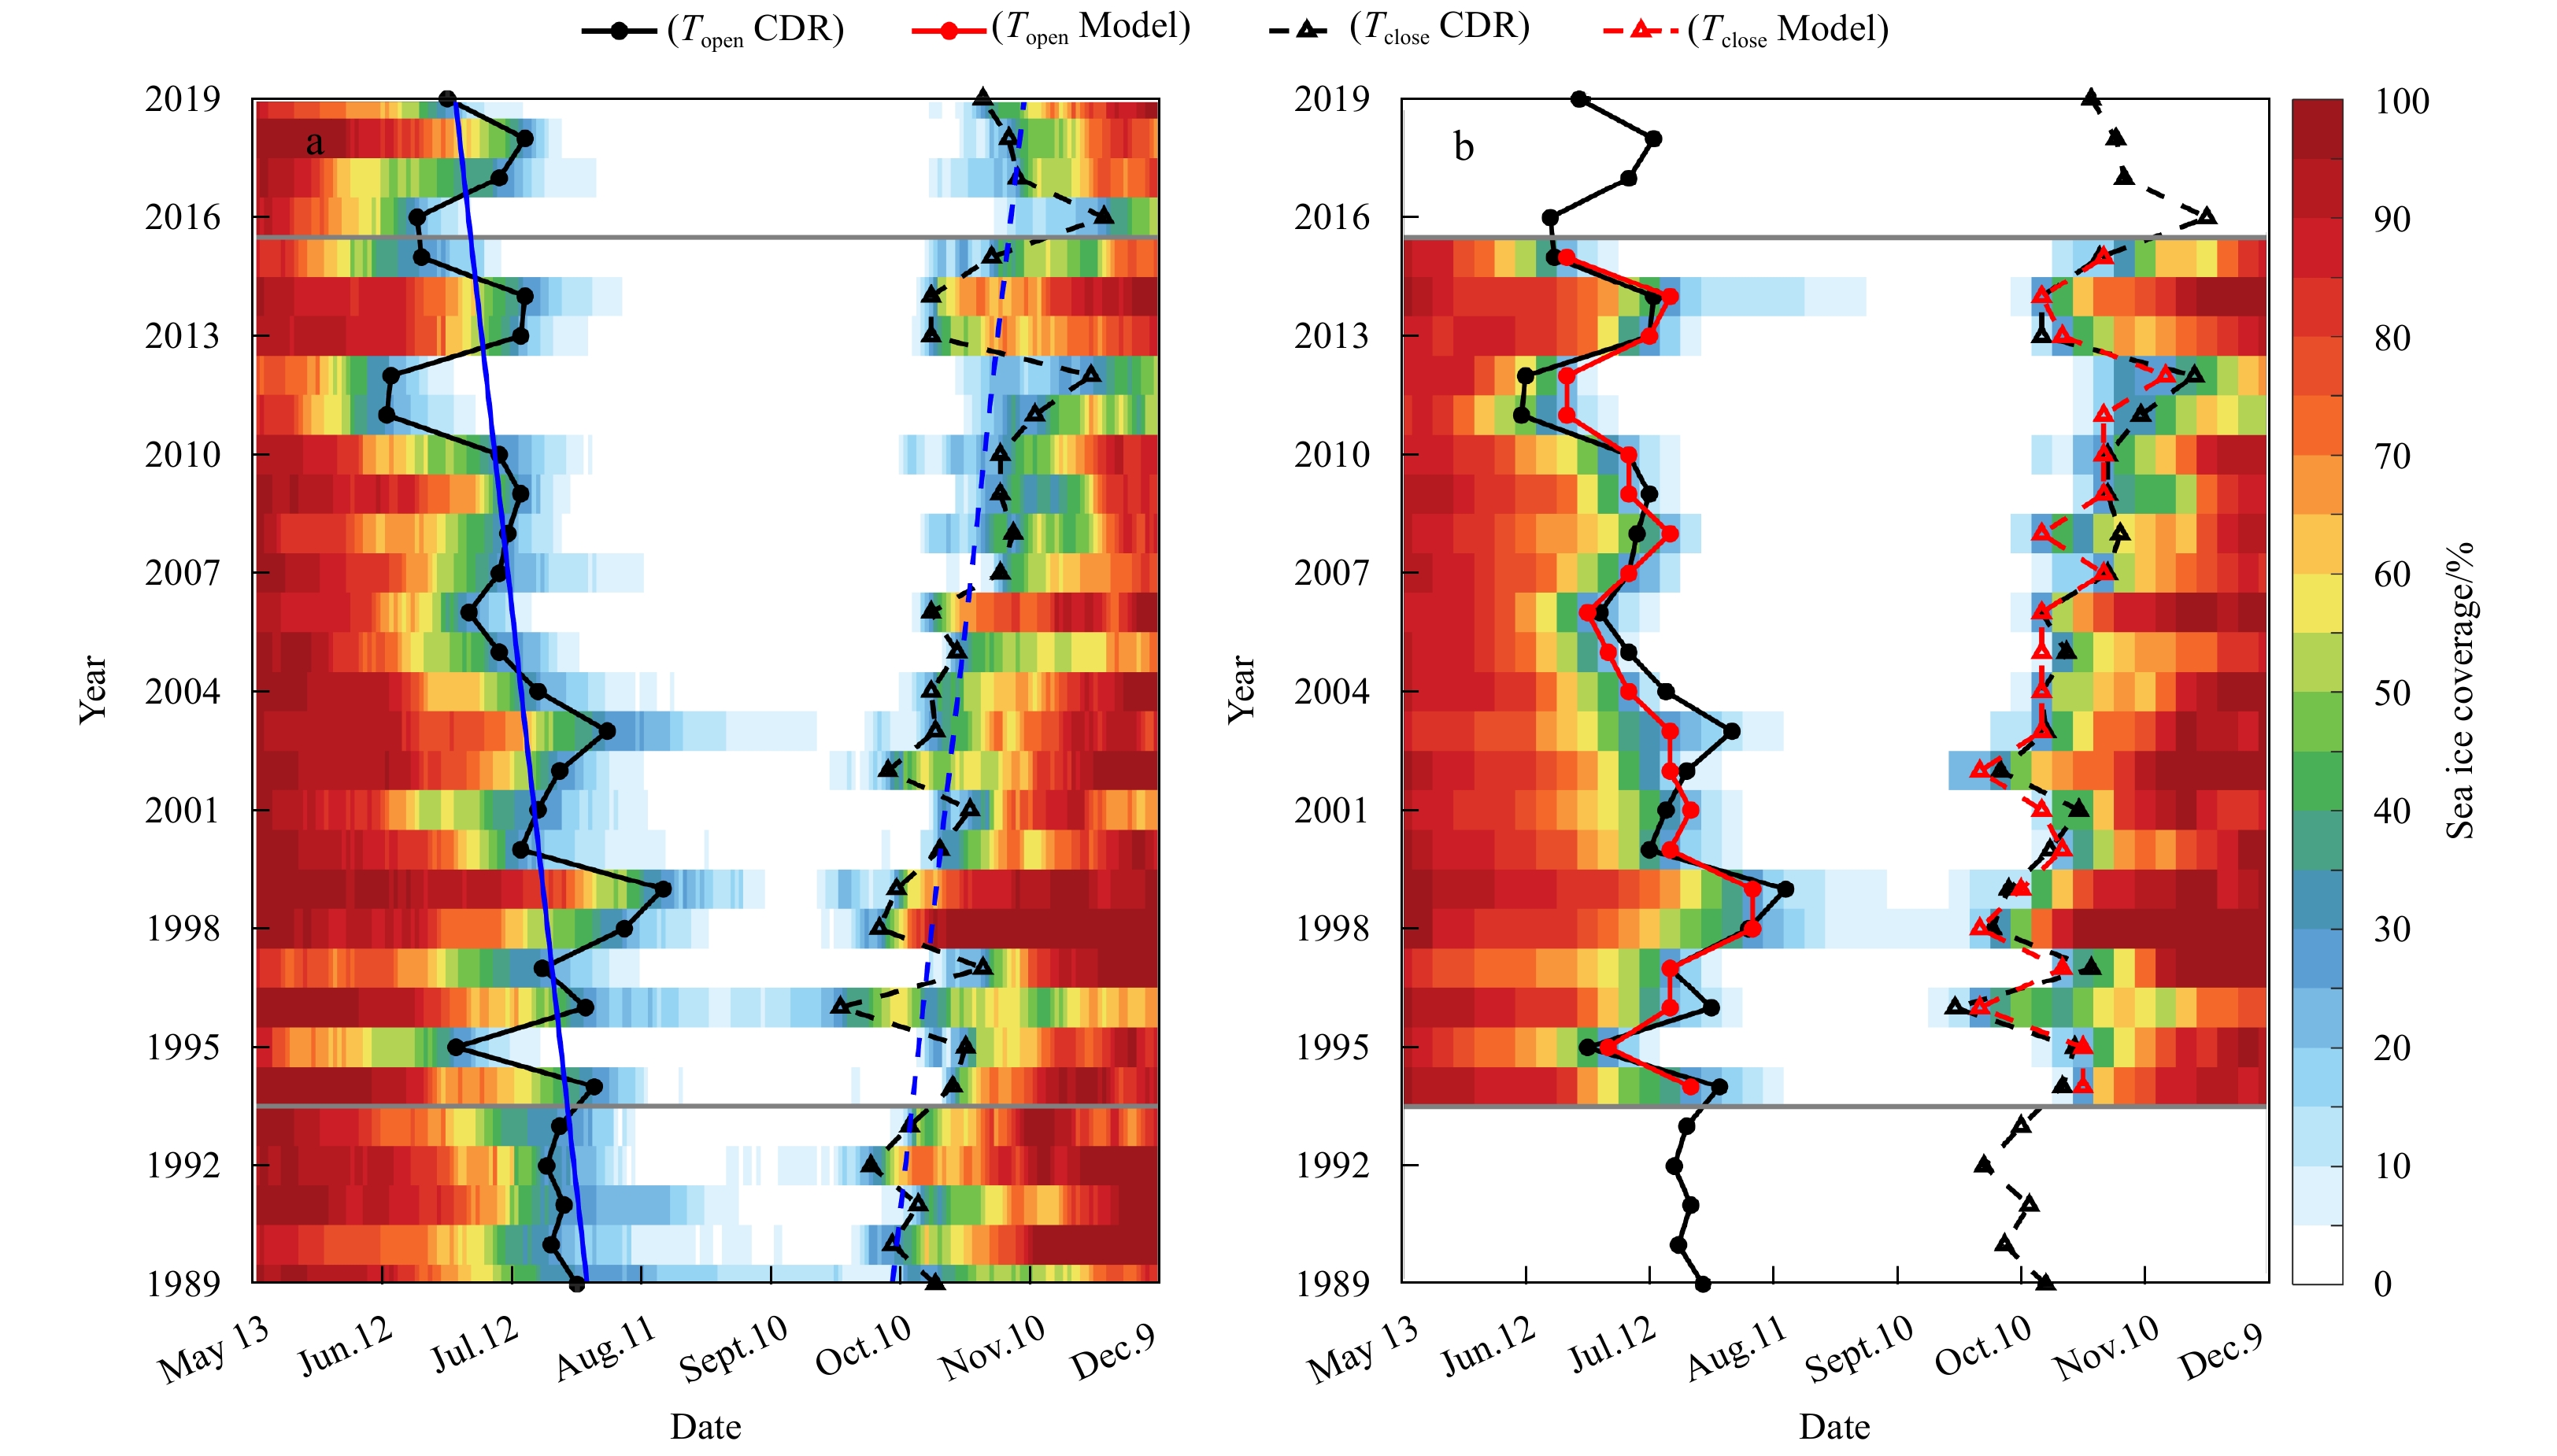
Figure 3. Variations in CR based on the climate data record (CDR) data set (a) and NAPA1/4 model (b). The black and red lines in both subfigures denote the Topen (solid) and Tclose (dashed), respectively. The blue lines represent the linear trend of Topen and Tclose based on the CDR.

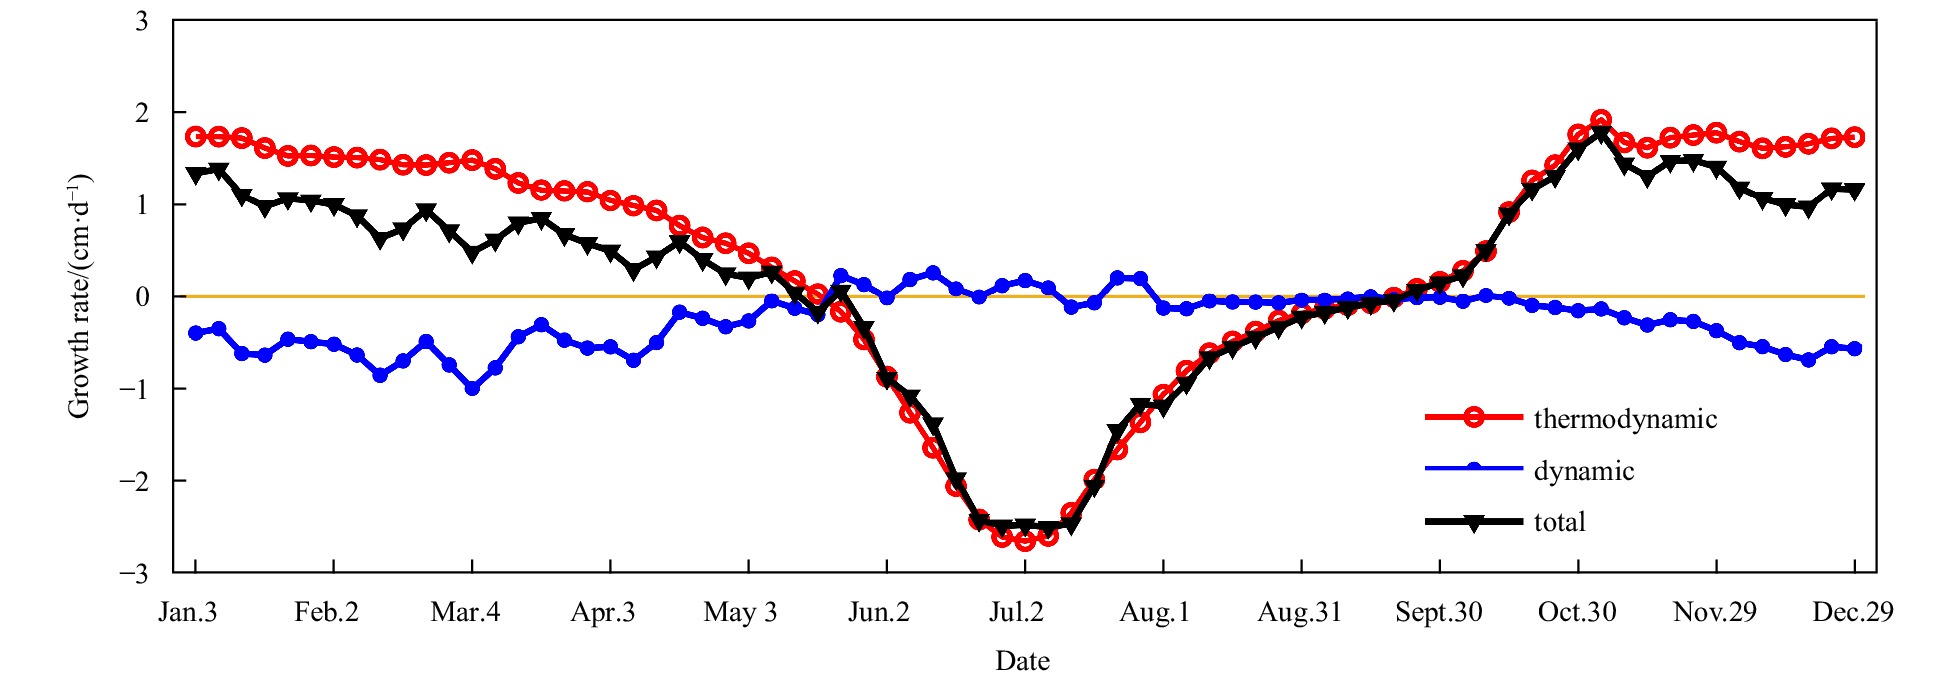
Figure 4. Annual cycle of sea ice growth and decay rate of ice thickness averaged over 1994–2015 based on NAPA1/4. The negative (positive) value indicates the sea ice decay (growth) rate. Lines with the red circle, blue dot and black triangle represent the thermodynamic, dynamic process and the total contributions to ice variation, respectively.
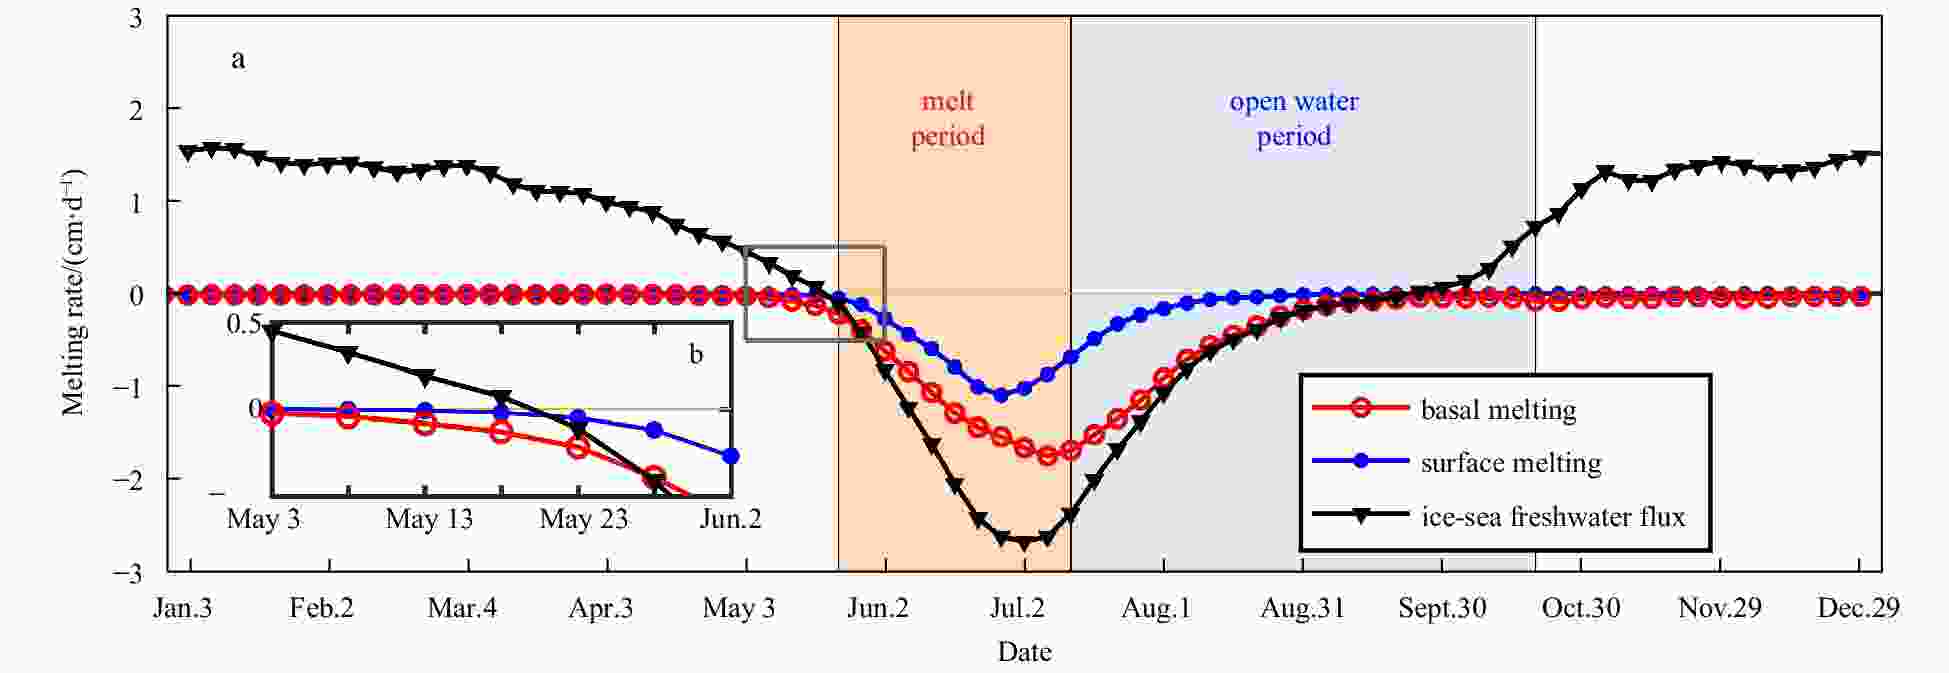
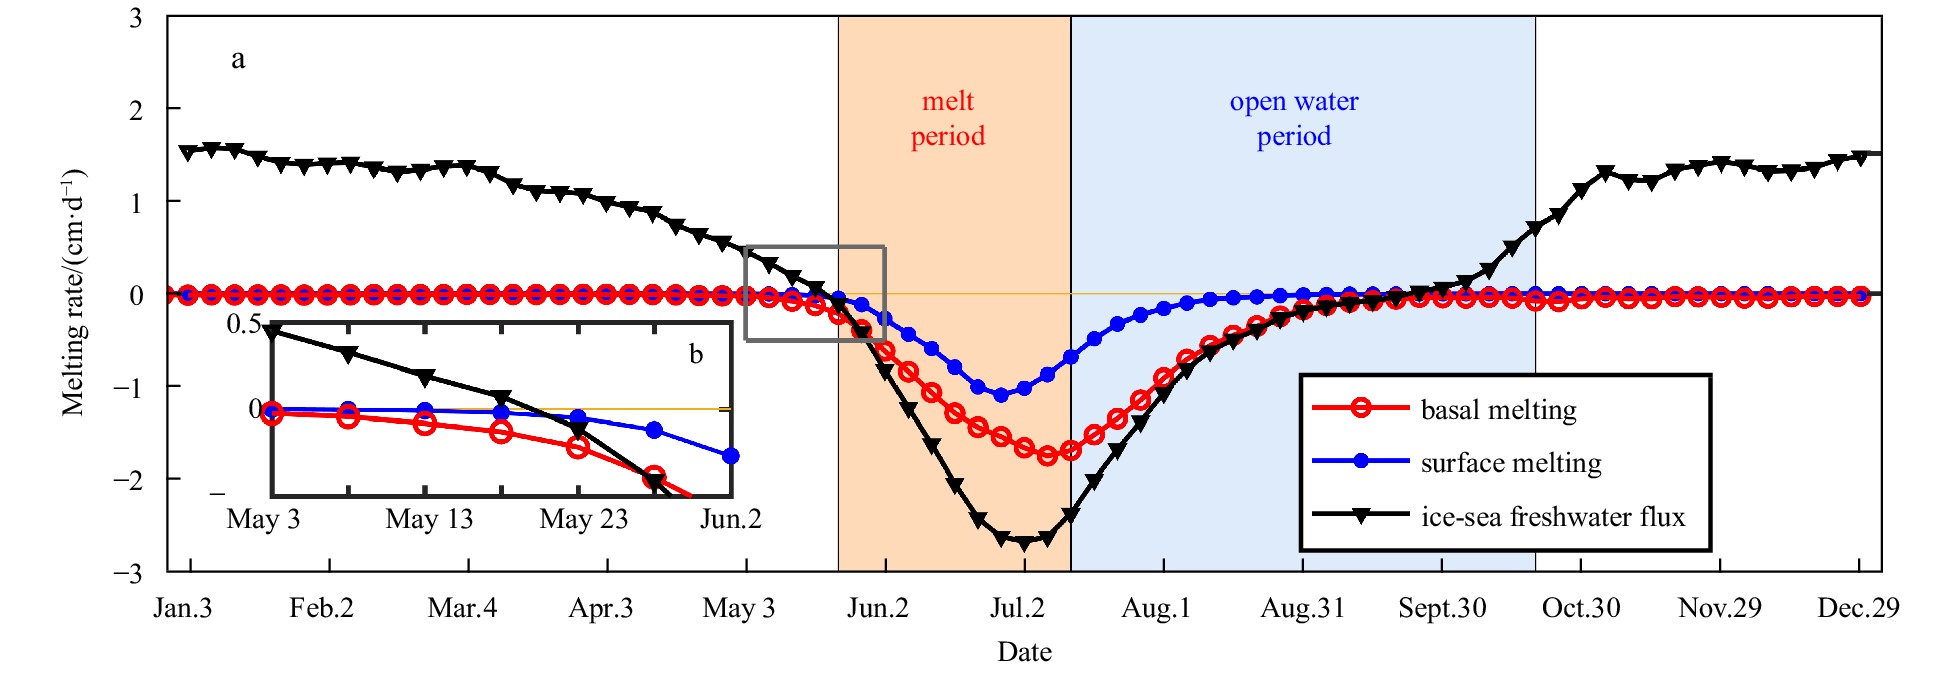
Figure 5. Annual cycle average of the sea ice surface melting rate (blue dot), basal melting rate (red circle), and freshwater flux from ice to the ocean (black triangle) in the Kara Sea averaged over 1994–2015 (a); and melting rates from May 3rd to June 2nd (box outlined in gray in a) (b). These variables are calculated from NAPA1/4 (see the guide book available at
http://www.climate.be/users/lecomte/LIM3_users_guide_2012.pdf ). The negative (positive) value indicates the sea ice melting (formation) rate.
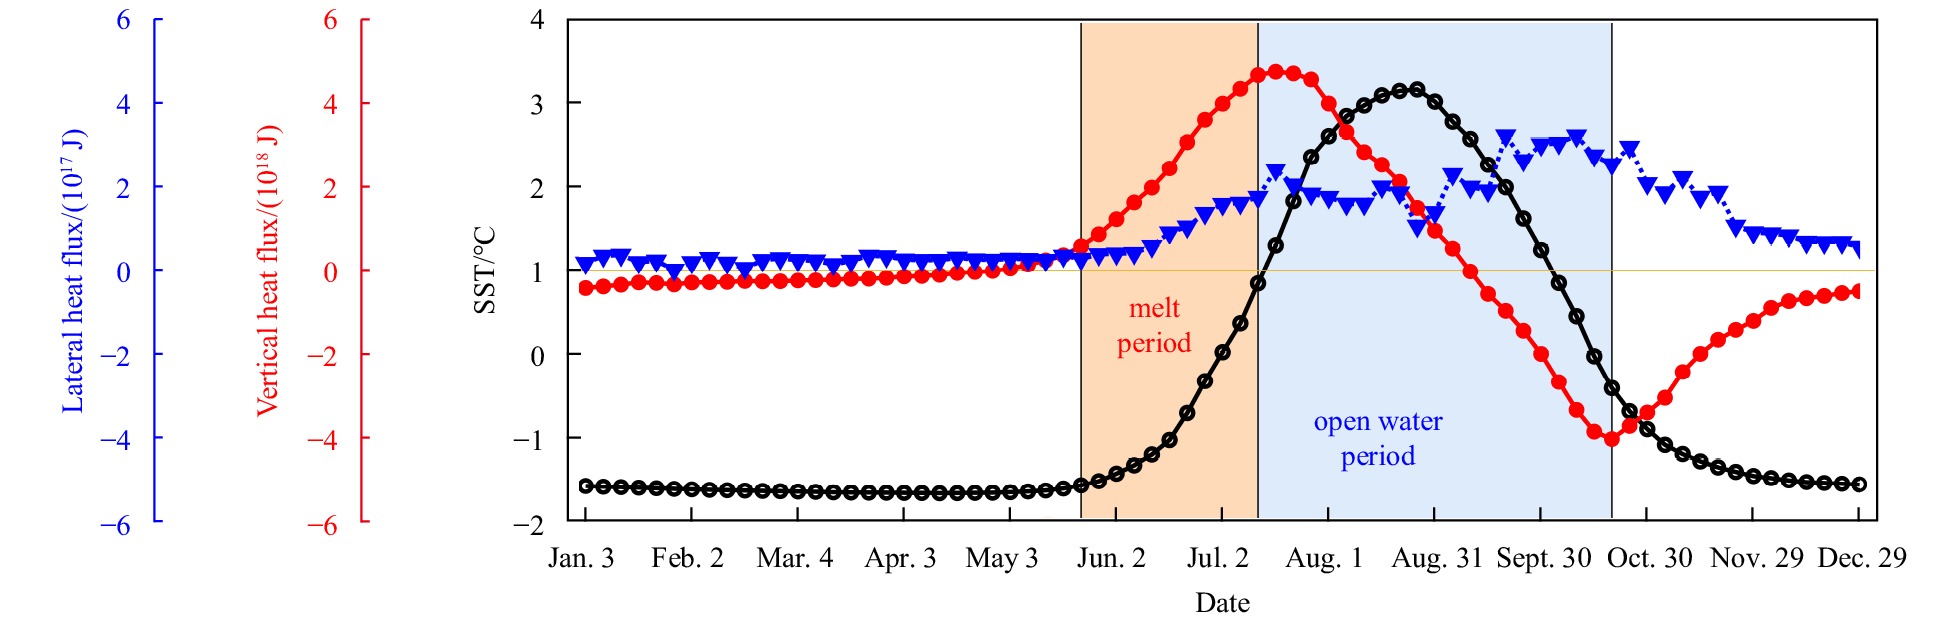
Figure 6. Annual cycles of regional mean sea surface temperature (black dot), the lateral (blue triangle) and vertical (red dot) net heat flux averaged over 1994–2015 based on NAPA1/4. Positive (negative) values denote heat absorption (release).
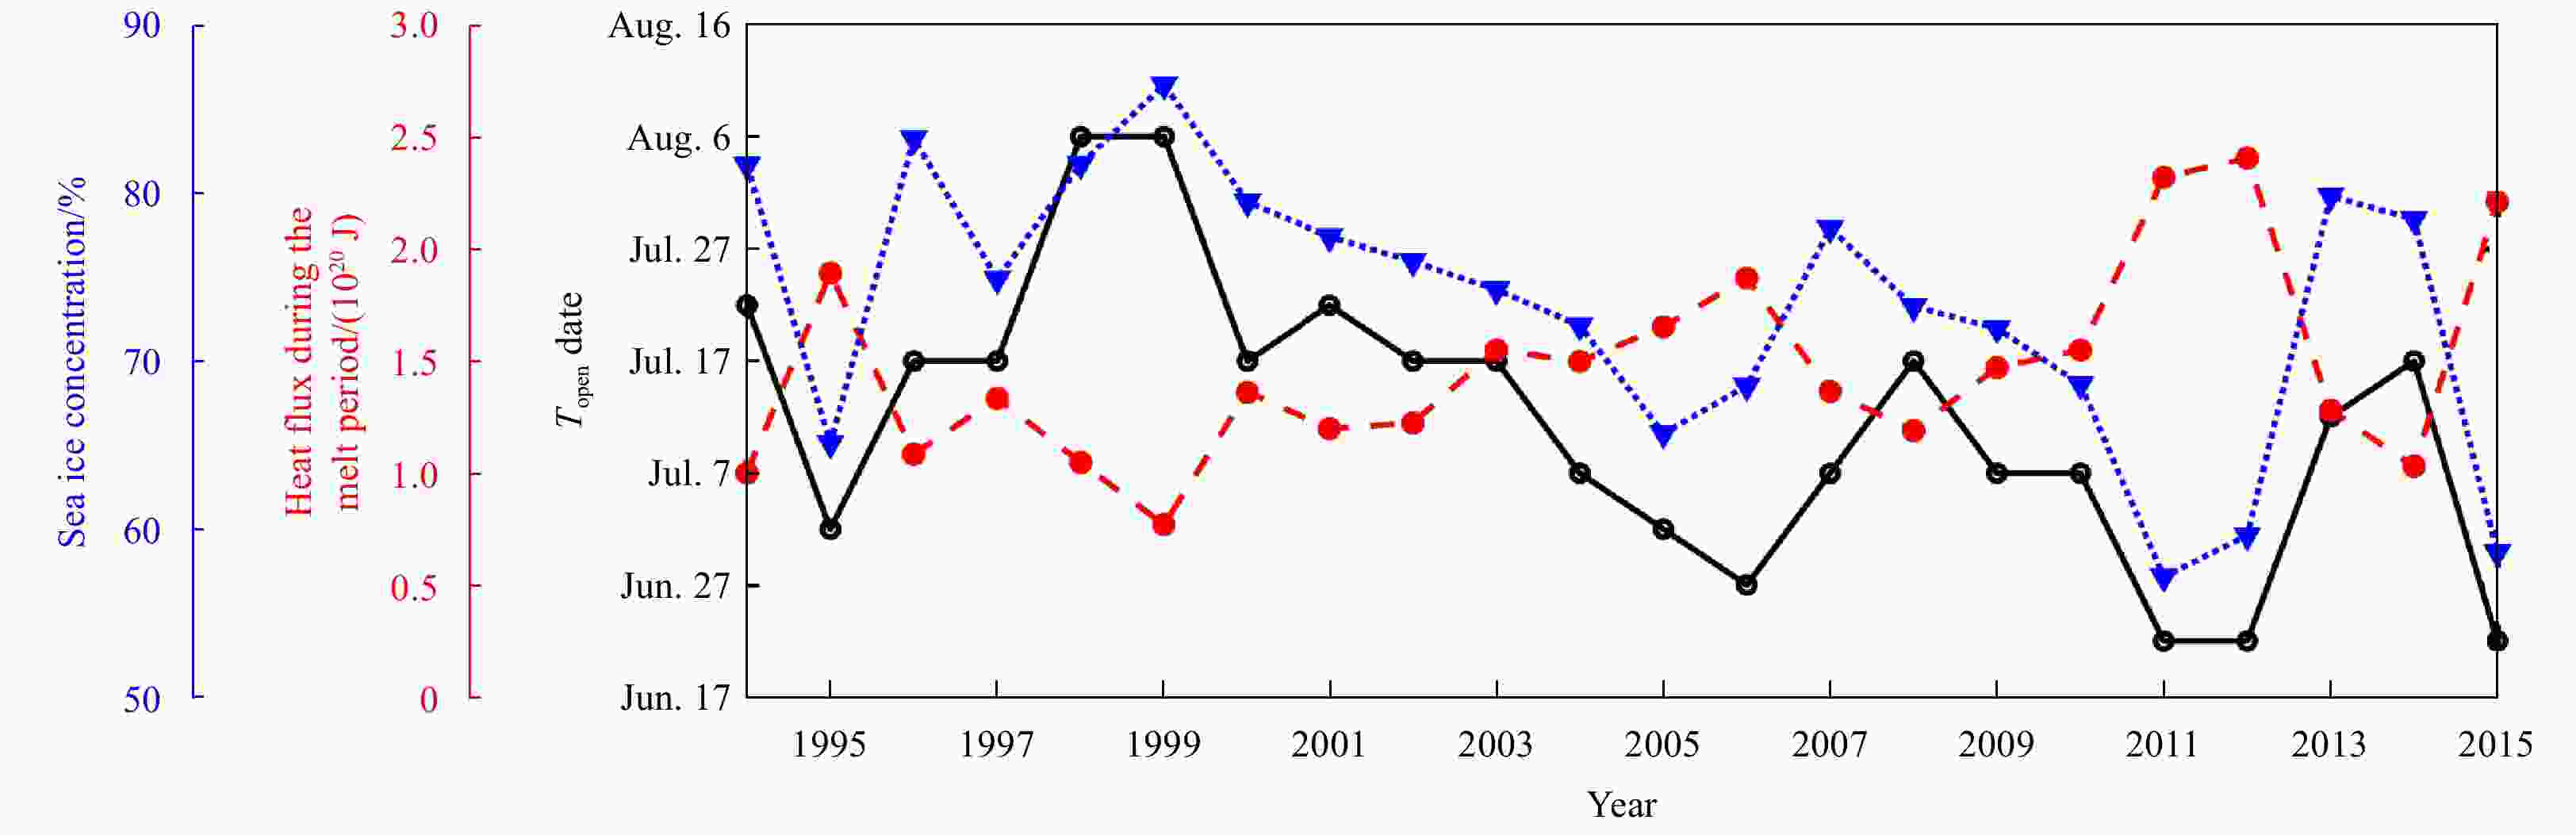
Figure 7. Interannual variations in sea ice concentration (blue triangle), Topen (black dot), and accumulated heat flux during the melt period (red dot) based on NAPA1/4 in the Kara Sea.
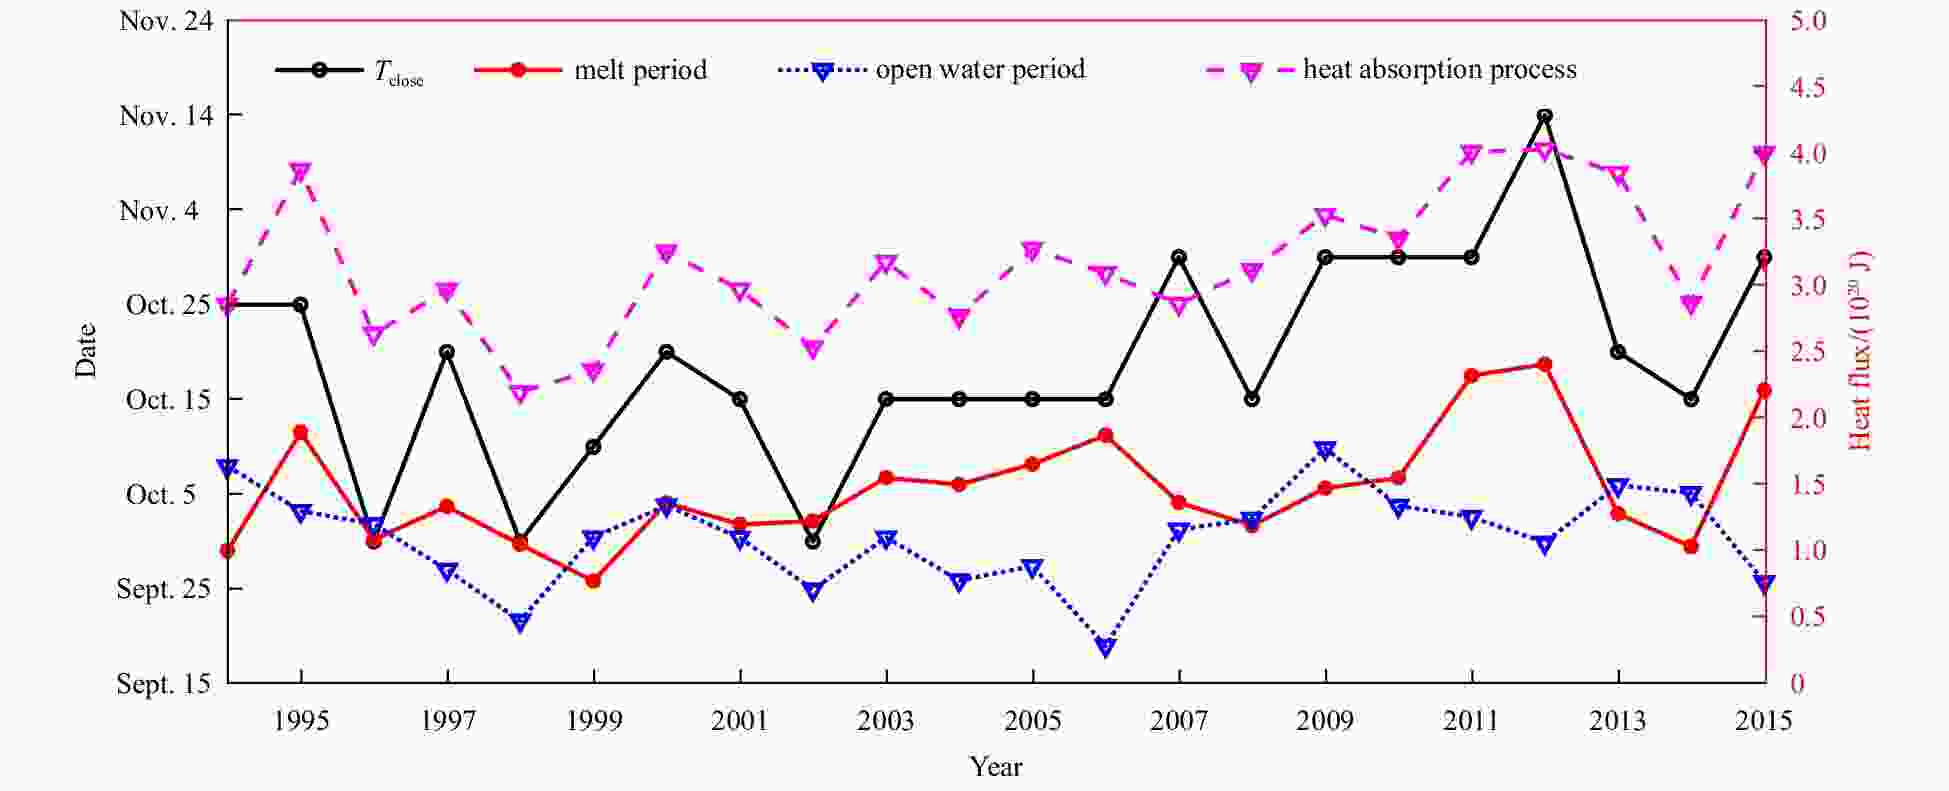
Figure 8. Interannual variations in Tclose (black circle), accumulated heat flux during the melt period (red dot), the open water period (blue triangle) and the heat absorption process (magenta triangle) based on NAPA1/4 in the Kara Sea.
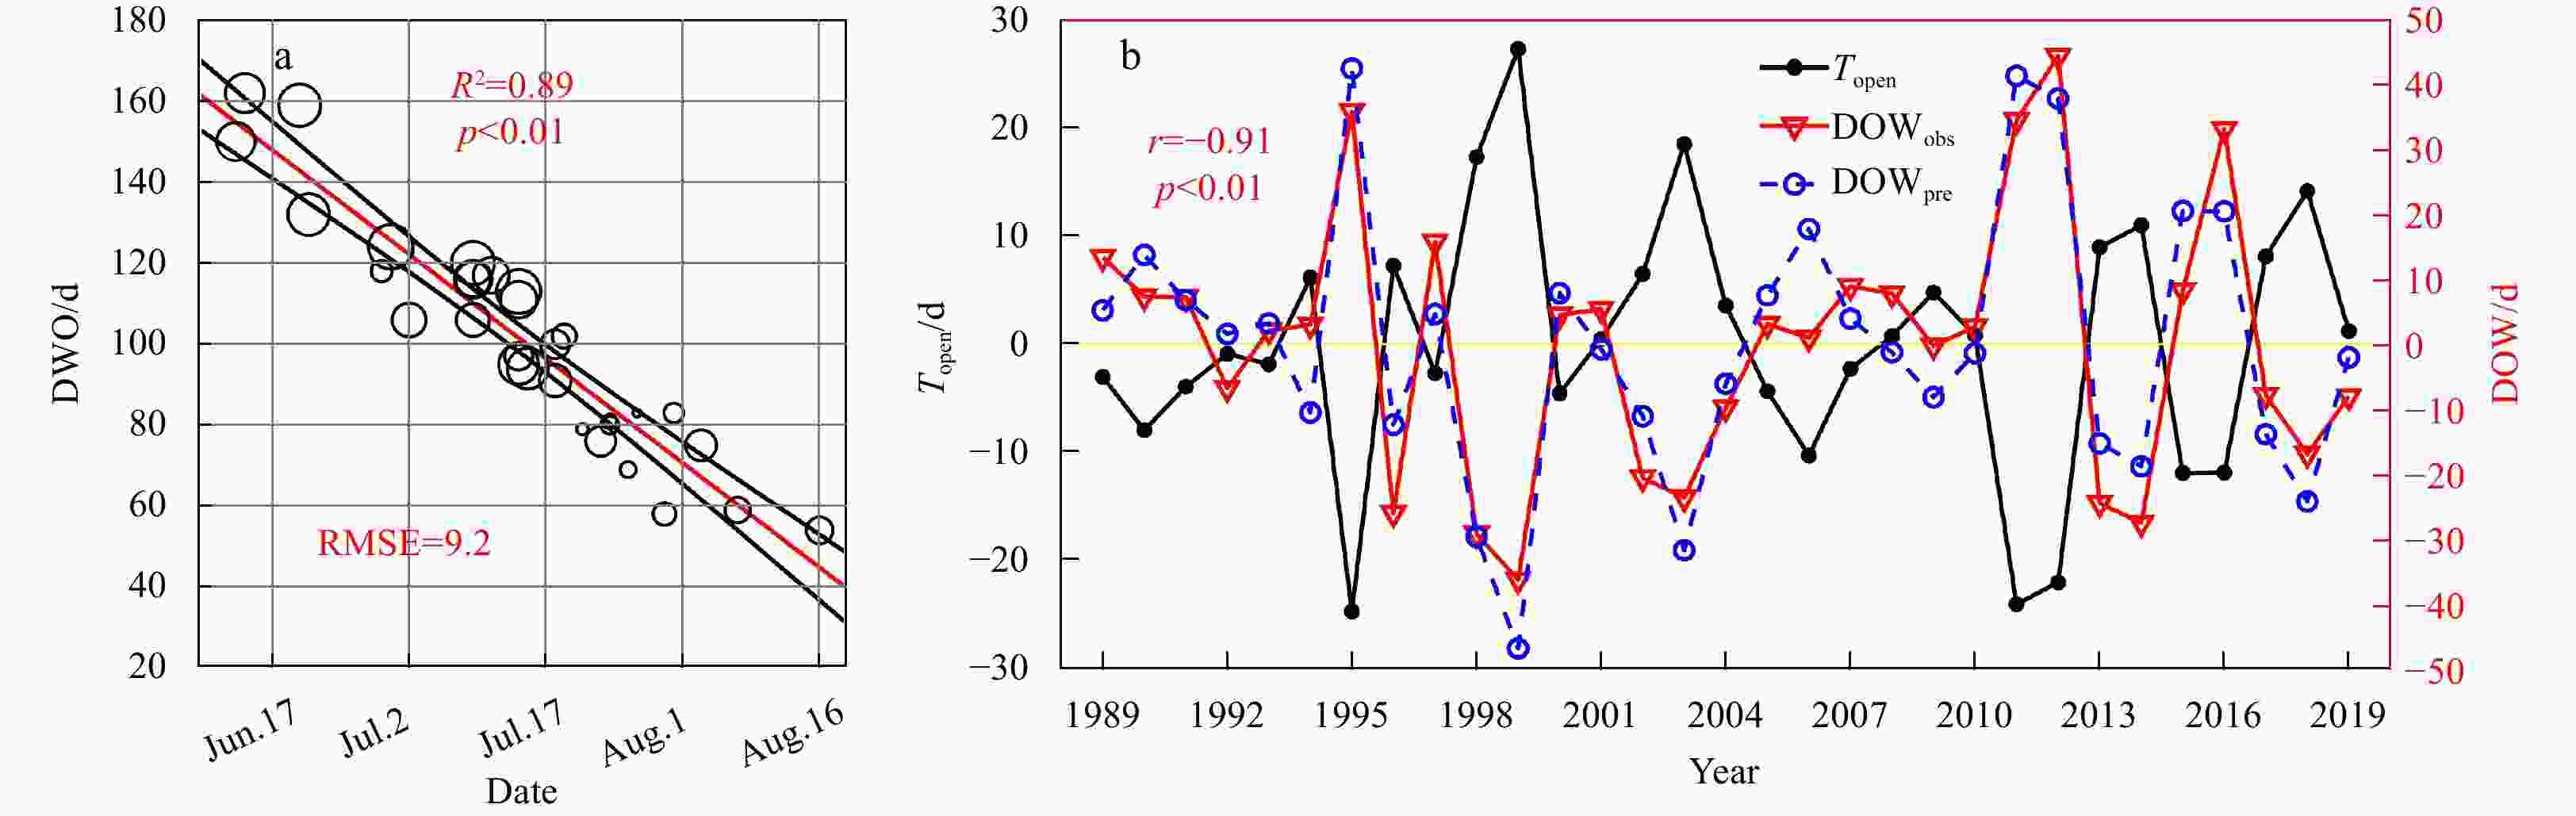
Figure 9. Relationship between Topen (black dot) and duration of open water (DOW) of the Kara Sea derived from the CDR data set. a. Scatter diagram of DOW versus Topen, with their linear regression shown by the red line and 95% confidence bounds shown by the black lines. The sizes of open circles increase from 1989 to 2019. b. Detrended time series from 1989 to 2019. The red triangle and blue circle lines denote CDR derived DOW (DOWobs) and predicted DOW (DOWpre), respectively.
-
[1] Aksenov Y, Popova E E, Yool A, et al. 2017. On the future navigability of Arctic sea routes: High-resolution projections of the Arctic Ocean and sea ice. Marine Policy, 75: 300–317. doi: 10.1016/j.marpol.2015.12.027 [2] Barnhart K R, Miller C R, Overeem I, et al. 2016. Mapping the future expansion of Arctic open water. Nature Climate Change, 6(3): 280–285. doi: 10.1038/nclimate2848 [3] Belchansky G I, Douglas D C, Platonov N G. 2004. Duration of the Arctic Sea ice melt season: Regional and interannual variability, 1979–2001. Journal of Climate, 17(1): 67–80. doi: 10.1175/1520-0442(2004)017<0067:DOTASI>2.0.CO;2 [4] Bird K J, Charpentier R R, Gautier D L, et al. 2008. Circum-arctic resource appraisal: Estimates of Undiscovered Oil and Gas North of the Arctic Circle. USGS Numbered Series 2008–3049. U.S. Geological Survey, 1–4 [5] Bitz C M, Holland M M, Weaver A J, et al. 2001. Simulating the ice-thickness distribution in a coupled climate model. Journal of Geophysical Research: Oceans, 106(C2): 2441–2463. doi: 10.1029/1999jc000113 [6] Blanchard-Wrigglesworth E, Armour K C, Bitz C M, et al. 2011. Persistence and inherent predictability of arctic sea ice in a GCM ensemble and observations. Journal of Climate, 24(1): 231–250. doi: 10.1175/2010JCLI3775.1 [7] Bliss A C, Anderson M R. 2014. Daily area of snow melt onset on Arctic sea ice from passive microwave satellite observations 1979–2012. Remote Sensing, 6(11): 11283–11314. doi: 10.3390/rs61111283 [8] Cavalieri D J, Gloersen P, Campbell W J. 1984. Determination of sea ice parameters with the Nimbus 7 SMMR. Journal of Geophysical Research: Atmospheres, 89(D4): 5355–5369. doi: 10.1029/JD089iD04p05355 [9] Cavalieri D J, Parkinson C L. 2012. Arctic sea ice variability and trends, 1979–2010. The Cryosphere, 6(4): 881–889. doi: 10.5194/tc-6-881-2012 [10] Chen Ping, Zhao Jinping. 2017. Impacts of surface wind on regional and integrated changes of sea ice in the Arctic. Periodical of Ocean University of China (in Chinese), 47(8): 1–12. doi: 10.16441/j.cnki.hdxb.20160212 [11] Comiso J C. 1986. Characteristics of Arctic winter sea ice from satellite multispectral microwave observations. Journal of Geophysical Research: Oceans, 91(C1): 975–994. doi: 10.1029/JC091iC01p00975 [12] Comiso J C, Nishio F. 2008. Trends in the sea ice cover using enhanced and compatible AMSR-E, SSM/I, and SMMR data. Journal of Geophysical Research: Oceans, 113(2): C02S07. doi: 10.1029/2007JC004257 [13] Curry J A, Schramm J L, Ebert E E. 1995. Sea ice-albedo climate feedback mechanism. Journal of Climate, 8(2): 240–247. doi: 10.1175/1520-0442(1995)008<0240:SIACFM>2.0.CO;2 [14] Dmitrenko I A, Rudels B, Kirillov S A, et al. 2015. Atlantic water flow into the Arctic Ocean through the St. Anna Trough in the northern Kara Sea. Journal of Geophysical Research: Oceans, 120(7): 5158–5178. doi: 10.1002/2015JC010804 [15] Duan Chenglin, Dong Sheng, Wang Zhifeng. 2019a. Sea ice regime in the Kara Sea during 2003–2017 based on high-resolution satellite data. Polish Polar Research, 40(3): 205–225. doi: 10.24425/ppr.2019.129671 [16] Duan Chenglin, Dong Sheng, Xie Zexiao, et al. 2019b. Temporal variability and trends of sea ice in the Kara Sea and their relationship with atmospheric factors. Polar Science, 20: 136–147. doi: 10.1016/j.polar.2019.03.002 [17] Flanner M G, Shell K M, Barlage M, et al. 2011. Radiative forcing and albedo feedback from the Northern Hemisphere cryosphere between 1979 and 2008. Nature Geoscience, 4(3): 151–155. doi: 10.1038/ngeo1062 [18] Gautier D L, Bird K J, Charpentier R R, et al. 2009. Assessment of undiscovered oil and gas in the Arctic. Science, 324(5931): 1175–1179. doi: 10.1126/science.1169467 [19] Hu Xianmin, Sun Jiangfan, Chan T O, et al. 2018. Thermodynamic and dynamic ice thickness contributions in the Canadian Arctic Archipelago in NEMO-LIM2 numerical simulations. The Cryosphere, 12(4): 1233–1247. doi: 10.5194/tc-12-1233-2018 [20] Ikeda M, Wang Jiang, Zhao Jinping. 2011. Hypersensitive decadal oscillations in the Arctic/subarctic climate. Geophysical Research Letters, 28(7): 1275–1278. doi: 10.1029/2000GL011773 [21] Johnson M A, Eicken H. 2016. Estimating Arctic sea-ice freeze-up and break-up from the satellite record: A comparison of different approaches in the Chukchi and Beaufort Seas. Elementa-Science of the Anthropocene, 4: 000124. doi: 10.12952/journal.elementa.000124 [22] Kern S, Harms I, Bakan S, et al. 2005. A comprehensive view of Kara Sea polynya dynamics, sea-ice compactness and export from model and remote sensing data. Geophysical Research Letters, 32(15): L15501. doi: 10.1029/2005GL023532 [23] Kim K Y, Hamlington B D, Na H N, et al. 2016. Mechanism of seasonal Arctic sea ice evolution and Arctic amplification. The Cryosphere, 10(5): 2191–2202. doi: 10.5194/tc-10-2191-2016 [24] Lebrun M, Vancoppenolle M, Madec G, et al. 2019. Arctic sea-ice-free season projected to extend into autumn. The Cryosphere, 13(1): 79–96. doi: 10.5194/tc-13-79-2019 [25] Lei Ruibo, Tian-Kunze X, Leppäranta M, et al. 2016. Changes in summer sea ice, albedo, and portioning of surface solar radiation in the Pacific sector of Arctic Ocean during 1982–2009. Journal of Geophysical Research: Oceans, 121(8): 5470–5486. doi: 10.1002/2016JC011831 [26] Lei Ruibo, Xie Hongjie, Wang Jia, et al. 2015. Changes in sea ice conditions along the Arctic Northeast Passage from 1979 to 2012. Cold Regions Science and Technology, 119: 132–144. doi: 10.1016/j.coldregions.2015.08.004 [27] Leifer I, Chen F R, McClimans T, et al. 2018. Satellite ice extent, sea surface temperature, and atmospheric methane trends in the Barents and Kara seas. The Cryosphere Discuss, 1–45. doi: 10.5194/tc-2018-75 [28] Lien V S, Schlichtholz P, Skagseth Ø, et al. 2017. Wind-driven atlantic water flow as a direct mode for reduced barents sea ice cover. Journal of Climate, 30(2): 803–812. doi: 10.1175/jcli-d-16-0025.1 [29] Lindsay R, Schweiger A. 2015. Arctic sea ice thickness loss determined using subsurface, aircraft, and satellite observations. The Cryosphere, 9(1): 269–283. doi: 10.5194/tc-9-269-2015 [30] Lindsay R W, Zhang Jinlun. 2005. The thinning of Arctic Sea Ice, 1988–2003: have we passed a tipping point?. Journal of Climate, 18(22): 4879–4894. doi: 10.1175/JCLI3587.1 [31] Luo Xiaofan, Hu Xianmin, Nie Hongtao, et al. 2019. Evaluation of hindcast simulation with the ocean and sea-ice model covering the Arctic and adjacent oceans. Haiyang Xuebao (in Chinese), 41(9): 1–12. doi: 10.3969/j.issn.0253-4193.2019.09.001 [32] Madec G. 2008. NEMO ocean engine, version 3.6. Note du Pôle de Modélisation, Institut Pierre-Simon Laplace, 27: 386 [33] Madec G, Imbard M. 1996. A global ocean mesh to overcome the North Pole singularity. Climate Dynamics, 12(6): 381–388. doi: 10.1007/BF00211684 [34] Markus T, Stroeve J C, Miller J. 2009. Recent changes in Arctic sea ice melt onset, freezeup, and melt season length. Journal of Geophysical Research: Oceans, 114(C12): C12024. doi: 10.1029/2009JC005436 [35] Maslanik J A, Serreze M C, Barry R G. 1996. Recent decreases in Arctic summer ice cover and linkages to atmospheric circulation anomalies. Geophysical Research Letters, 23(13): 1677–1680. doi: 10.1029/96GL01426 [36] Meier W N, Fetterer F, Duerr R, et al. 2017. NOAA/NSIDC climate data record of passive microwave sea ice concentration, Version 3. Boulder, Colorado USA. NSIDC: National Snow and Ice Data Center, doi: 10.7265/N59P2ZTG [37] Mysak L A, Venegas S A. 1998. Decadal climate oscillations in the Arctic: A new feedback loop for atmosphere-ice-ocean interactions. Geophysical Research Letters, 25(19): 3607–3610. doi: 10.1029/98GL02782 [38] Navy’s Task Force Climate Change. 2014. The United States navy arctic roadmap for 2014 to 2030. Washington, D C: University of North Texas Libraries, UNT Digital Library [39] Ogi M, Rigor I G, McPhee M G, et al. 2008. Summer retreat of Arctic sea ice: Role of summer winds. Geophysical Research Letters, 35(24): L24701. doi: 10.1029/2008GL035672 [40] Onarheim I H, Eldevik T, Smedsrud L H, et al. 2018. Seasonal and regional manifestation of arctic sea ice loss. Journal of Climate, 31(12): 4917–4932. doi: 10.1175/JCLI-D-17-0427.1 [41] Osadchiev A A, Izhitskiy A S, Zavialov P O, et al. 2017. Structure of the buoyant plume formed by Ob and Yenisei river discharge in the southern part of the Kara Sea during summer and autumn. Journal of Geophysical Research: Oceans, 122(7): 5916–5935. doi: 10.1002/2016JC012603 [42] Perovich D K, Light B, Eicken H, et al. 2007b. Increasing solar heating of the Arctic Ocean and adjacent seas, 1979–2005: Attribution and role in the ice-albedo feedback. Geophysical Research Letters, 34(19): L19505. doi: 10.1029/2007GL031480 [43] Perovich D K, Nghiem S V, Markus T, et al. 2007a. Seasonal evolution and interannual variability of the local solar energy absorbed by the Arctic sea ice-ocean system. Journal of Geophysical Research: Oceans, 112(3): C03005. doi: 10.1029/2006JC003558 [44] Polyakov I V, Alekseev G V, Bekryaev R V, et al. 2003. Long-term ice variability in Arctic marginal seas. Journal of Climate, 16(12): 2078–2085. doi: 10.1175/1520-0442(2003)016<2078:LIVIAM>2.0.CO;2 [45] Rigor I G, Wallace J M, Colony R L. 2002. Response of sea ice to the Arctic oscillation. Journal of Climate, 15(18): 2648–2663. doi: 10.1175/1520-0442(2002)015<2648:ROSITT>2.0.CO;2 [46] Rousset C, Vancoppenolle M, Madec G, et al. 2015. The Louvain-La-Neuve sea ice model LIM3.6: global and regional capabilities. Geoscientific Model Development, 8(10): 2991–3005. doi: 10.5194/gmd-8-2991-2015 [47] Screen J A, Simmonds I. 2010. The central role of diminishing sea ice in recent Arctic temperature amplification. Nature, 464(7293): 1334–1337. doi: 10.1038/nature09051 [48] Serreze M C, Barry R G. 2011. Processes and impacts of Arctic amplification: A research synthesis. Global and Planetary Change, 77(1–2): 85–96. doi: 10.1016/j.gloplacha.2011.03.004 [49] Serreze M C, Crawford A D, Stroeve J C, et al. 2016. Variability, trends, and predictability of seasonal sea ice retreat and advance in the Chukchi Sea. Journal of Geophysical Research: Oceans, 121(10): 7308–7325. doi: 10.1002/2016JC011977 [50] Simmonds I. 2015. Comparing and contrasting the behaviour of Arctic and Antarctic sea ice over the 35 year period 1979–2013. Annals of Glaciology, 56(691): 18–28. doi: 10.3189/2015AoG69A909 [51] Stammerjohn S, Massom R, Rind D, et al. 2012. Regions of rapid sea ice change: An inter-hemispheric seasonal comparison. Geophysical Research Letters, 39(6): L06501. doi: 10.1029/2012GL050874 [52] Stroeve J C, Crawford A D, Stammerjohn S. 2016. Using timing of ice retreat to predict timing of fall freeze-up in the Arctic. Geophysical Research Letters, 43(12): 6332–6340. doi: 10.1002/2016GL069314 [53] Stroeve J C, Markus T, Boisvert L, et al. 2014. Changes in Arctic melt season and implications for sea ice loss. Geophysical Research Letters, 41(4): 1216–1225. doi: 10.1002/2013GL058951 [54] Stroeve J C, Notz D. 2018. Changing state of Arctic sea ice across all seasons. Environmental Research Letters, 13(10): 3001. doi: 10.1088/1748-9326/aade56 [55] Uotila P, Iovino D, Vancoppenolle M, et al. 2017. Comparing sea ice, hydrography and circulation between NEMO3.6 LIM3 and LIM2. Geoscientific Model Development, 10(2): 1009–1031. doi: 10.5194/gmd-10-1009-2017 [56] Vancoppenolle M, Fichefet T, Goosse H, et al. 2009. Simulating the mass balance and salinity of Arctic and Antarctic sea ice. 1. Model description and validation. Ocean Modelling, 27(1–2): 33–53. doi: 10.1016/j.ocemod.2008.10.005 [57] Wang Yali, Luo Xiaofan, Zhang Yongli, et al. 2019a. Heat budget analysis during the ice-melting season in the Chukchi Sea based on a model simulation. Chinese Science Bulletin (in Chinese), 64(33): 3485–3497. doi: 10.1360/N972019-00322 [58] Wang Yunhe, Bi Haibo, Huang Haijun, et al. 2019b. Satellite-observed trends in the Arctic sea ice concentration for the period 1979–2016. Journal of Oceanology and Limnology, 37(1): 18–37. doi: 10.1007/s00343-019-7284-0 [59] Woodgate R A. 2018. Increases in the Pacific inflow to the Arctic from 1990 to 2015, and insights into seasonal trends and driving mechanisms from year-round Bering Strait mooring data. Progress in Oceanography, 160: 124–154. doi: 10.1016/j.pocean.2017.12.007 [60] Woodgate R A, Stafford K M, Prahl F G. 2015. A synthesis of year-round interdisciplinary mooring measurements in the bering strait (1990–2014) and the RUSALCA Years (2004–2011). Oceanography, 28(3SI): 46–67. doi: 10.5670/oceanog.2015.57 [61] Zhang Jinlun, Rothrock D, Steele M. 2000. Recent changes in Arctic sea ice: The interplay between ice dynamics and thermodynamics. Journal of Climate, 13(17): 3099–3114. doi: 10.1175/1520-0442(2000)013<3099:RCIASI>2.0.CO;2 [62] Zhang Yongli, Wei Hao, Lu Youyu, et al. 2020. Dependence of Beaufort Sea low ice condition in the summer of 1998 on ice export in the prior winter. Journal of Climate, 33(21): 9247–9259. doi: 10.1175/jcli-d-19-0943.1 -

 下载:
下载:


 点击查看大图

计量
- 文章访问数: 1221
- HTML全文浏览量: 449
- PDF下载量: 48
- 被引次数: 0

