

Identification of the sensitive area for targeted observation to improve vertical thermal structure prediction in summer in the Yellow Sea
-
Abstract: The sensitive area of targeted observations for short-term (7 d) prediction of vertical thermal structure (VTS) in summer in the Yellow Sea was investigated. We applied the Conditional Nonlinear Optimal Perturbation (CNOP) method and an adjoint-free algorithm with the Regional Ocean Modeling System (ROMS). We used vertical integration of CNOP-type temperature errors to locate the sensitive areas, where reduction of initial errors is expected to yield the greatest improvement in VTS prediction for the selected verification area. The identified sensitive areas were northeast−southwest orientated northeast to the verification area, which were possibly related to the southwestward background currents. Then, we performed a series of sensitivity experiments to evaluate the effectiveness of the identified sensitive areas. Results show that initial errors in the identified sensitive areas had the greatest negative effect on VTS prediction in the verification area compared to errors in other areas (e.g., the verification area and areas to its east and northeast). Moreover, removal of initial errors through deploying simulated observations in the identified sensitive areas led to more refined prediction than correction of initial conditions in the verification area itself. Our results suggest that implementation of targeted observation in the CNOP-based sensitive areas is an effective method to improve short-term prediction of VTS in summer in the Yellow Sea.
-
Key words:
- targeted observation /
- sensitive area /
- vertical thermal structure (VTS) /
- conditional nonlinear optimal perturbation (CNOP)
-
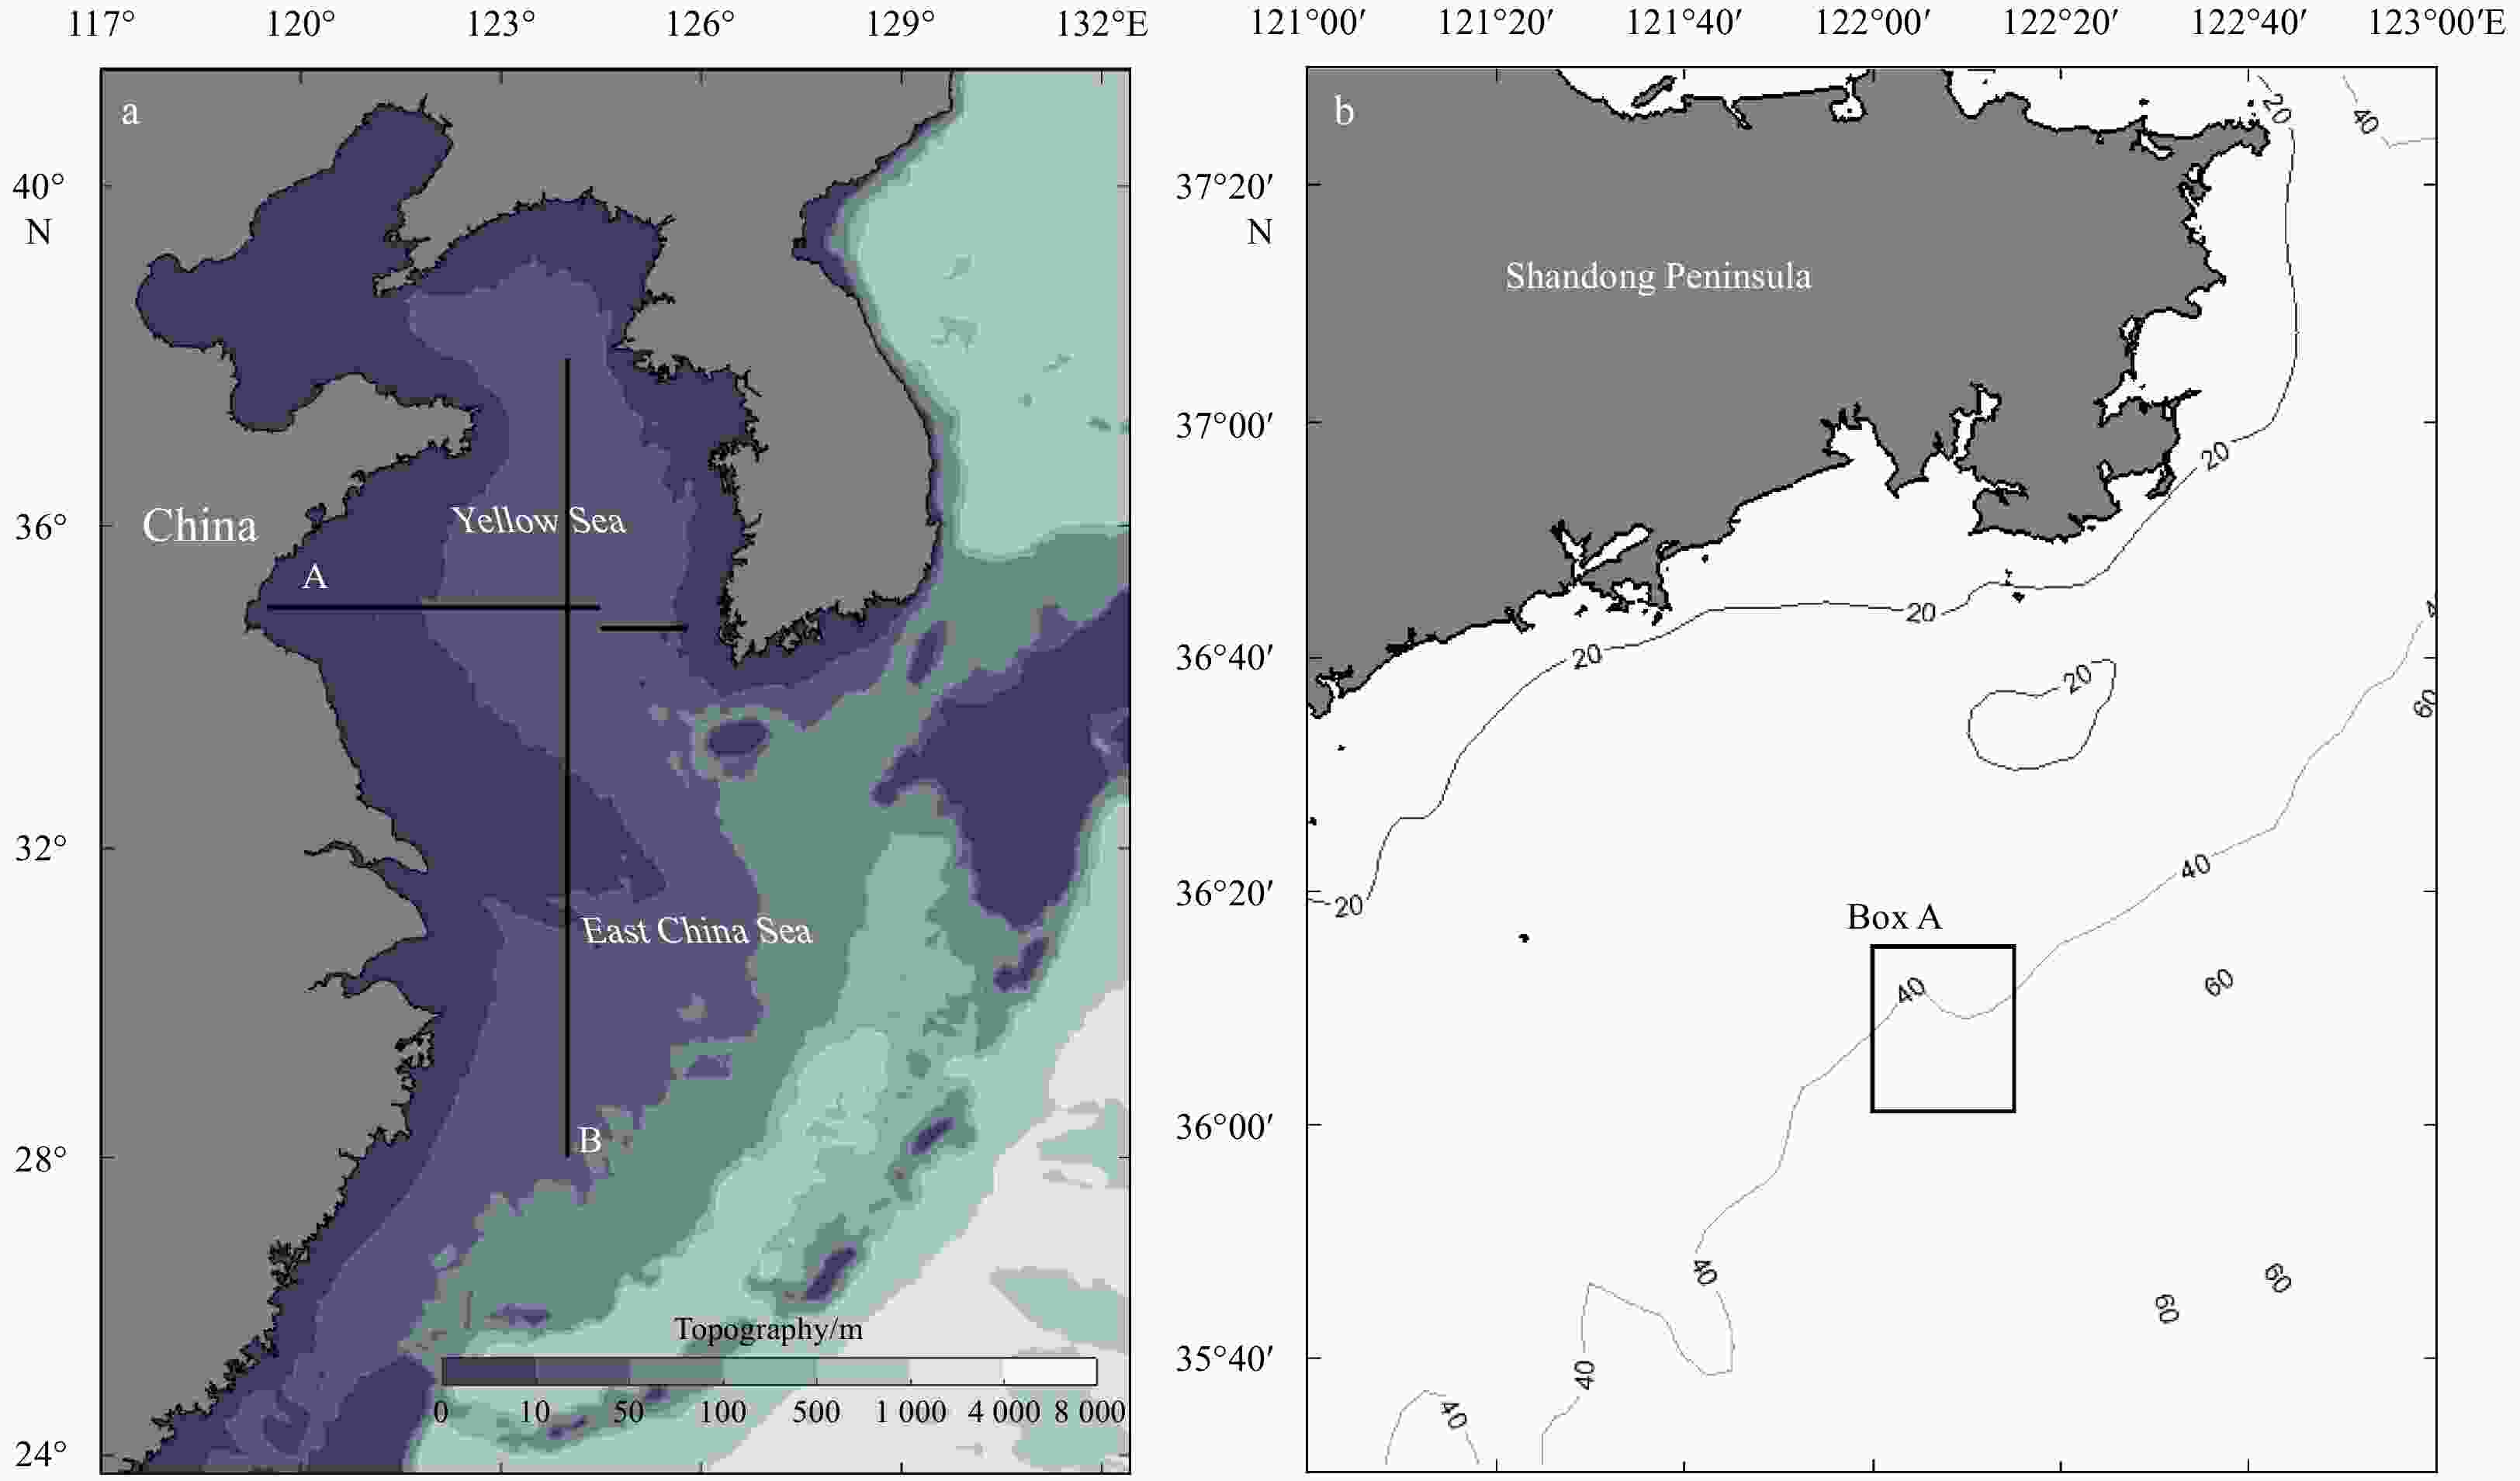
Figure 1. Model domain and topography (depth, m) of model grids (a), and topography (m) of the mid-western part of the Yellow Sea (b). The black solid lines A and B in a indicate locations of the validation sections; the box with black solid line (Box A) in b indicates the location of the selected verification area.
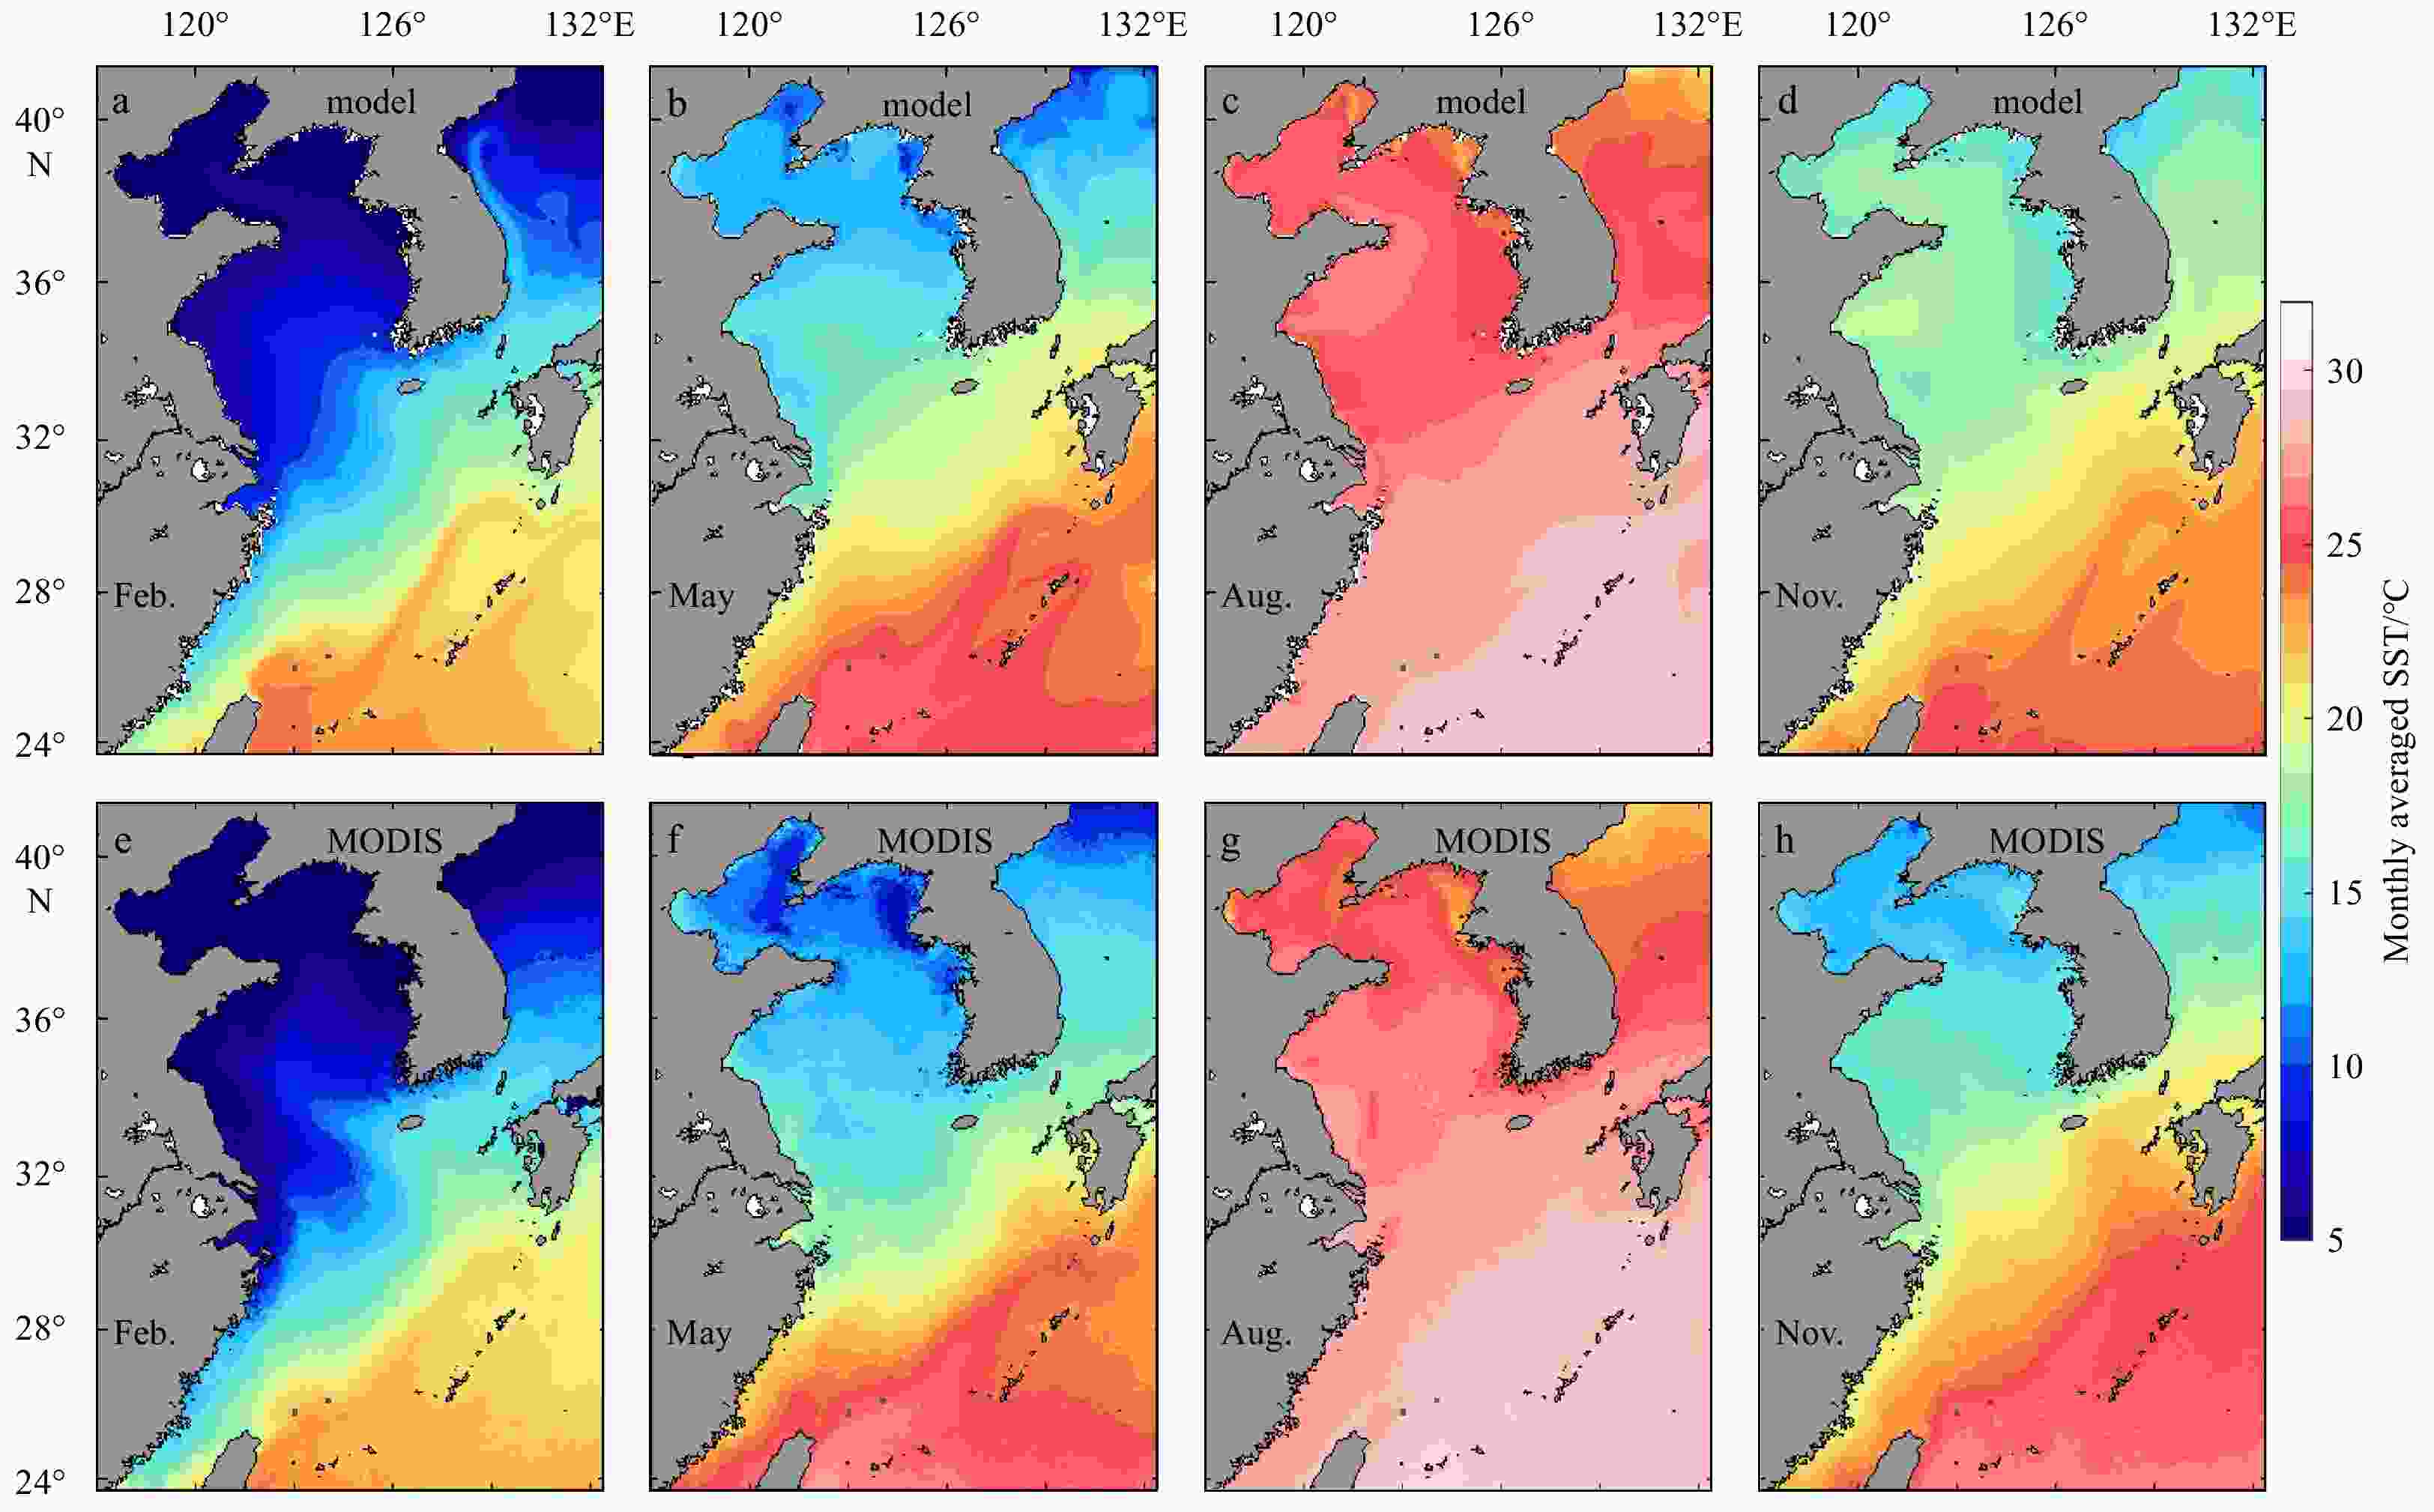
Figure 2. Monthly averaged SST in February, May, August, and November (from left to right) from the climatological simulation of model (upper row, a–d), and the multi-year averaged SST in the corresponding months from the satellite data of MODIS (bottom row, e–h).
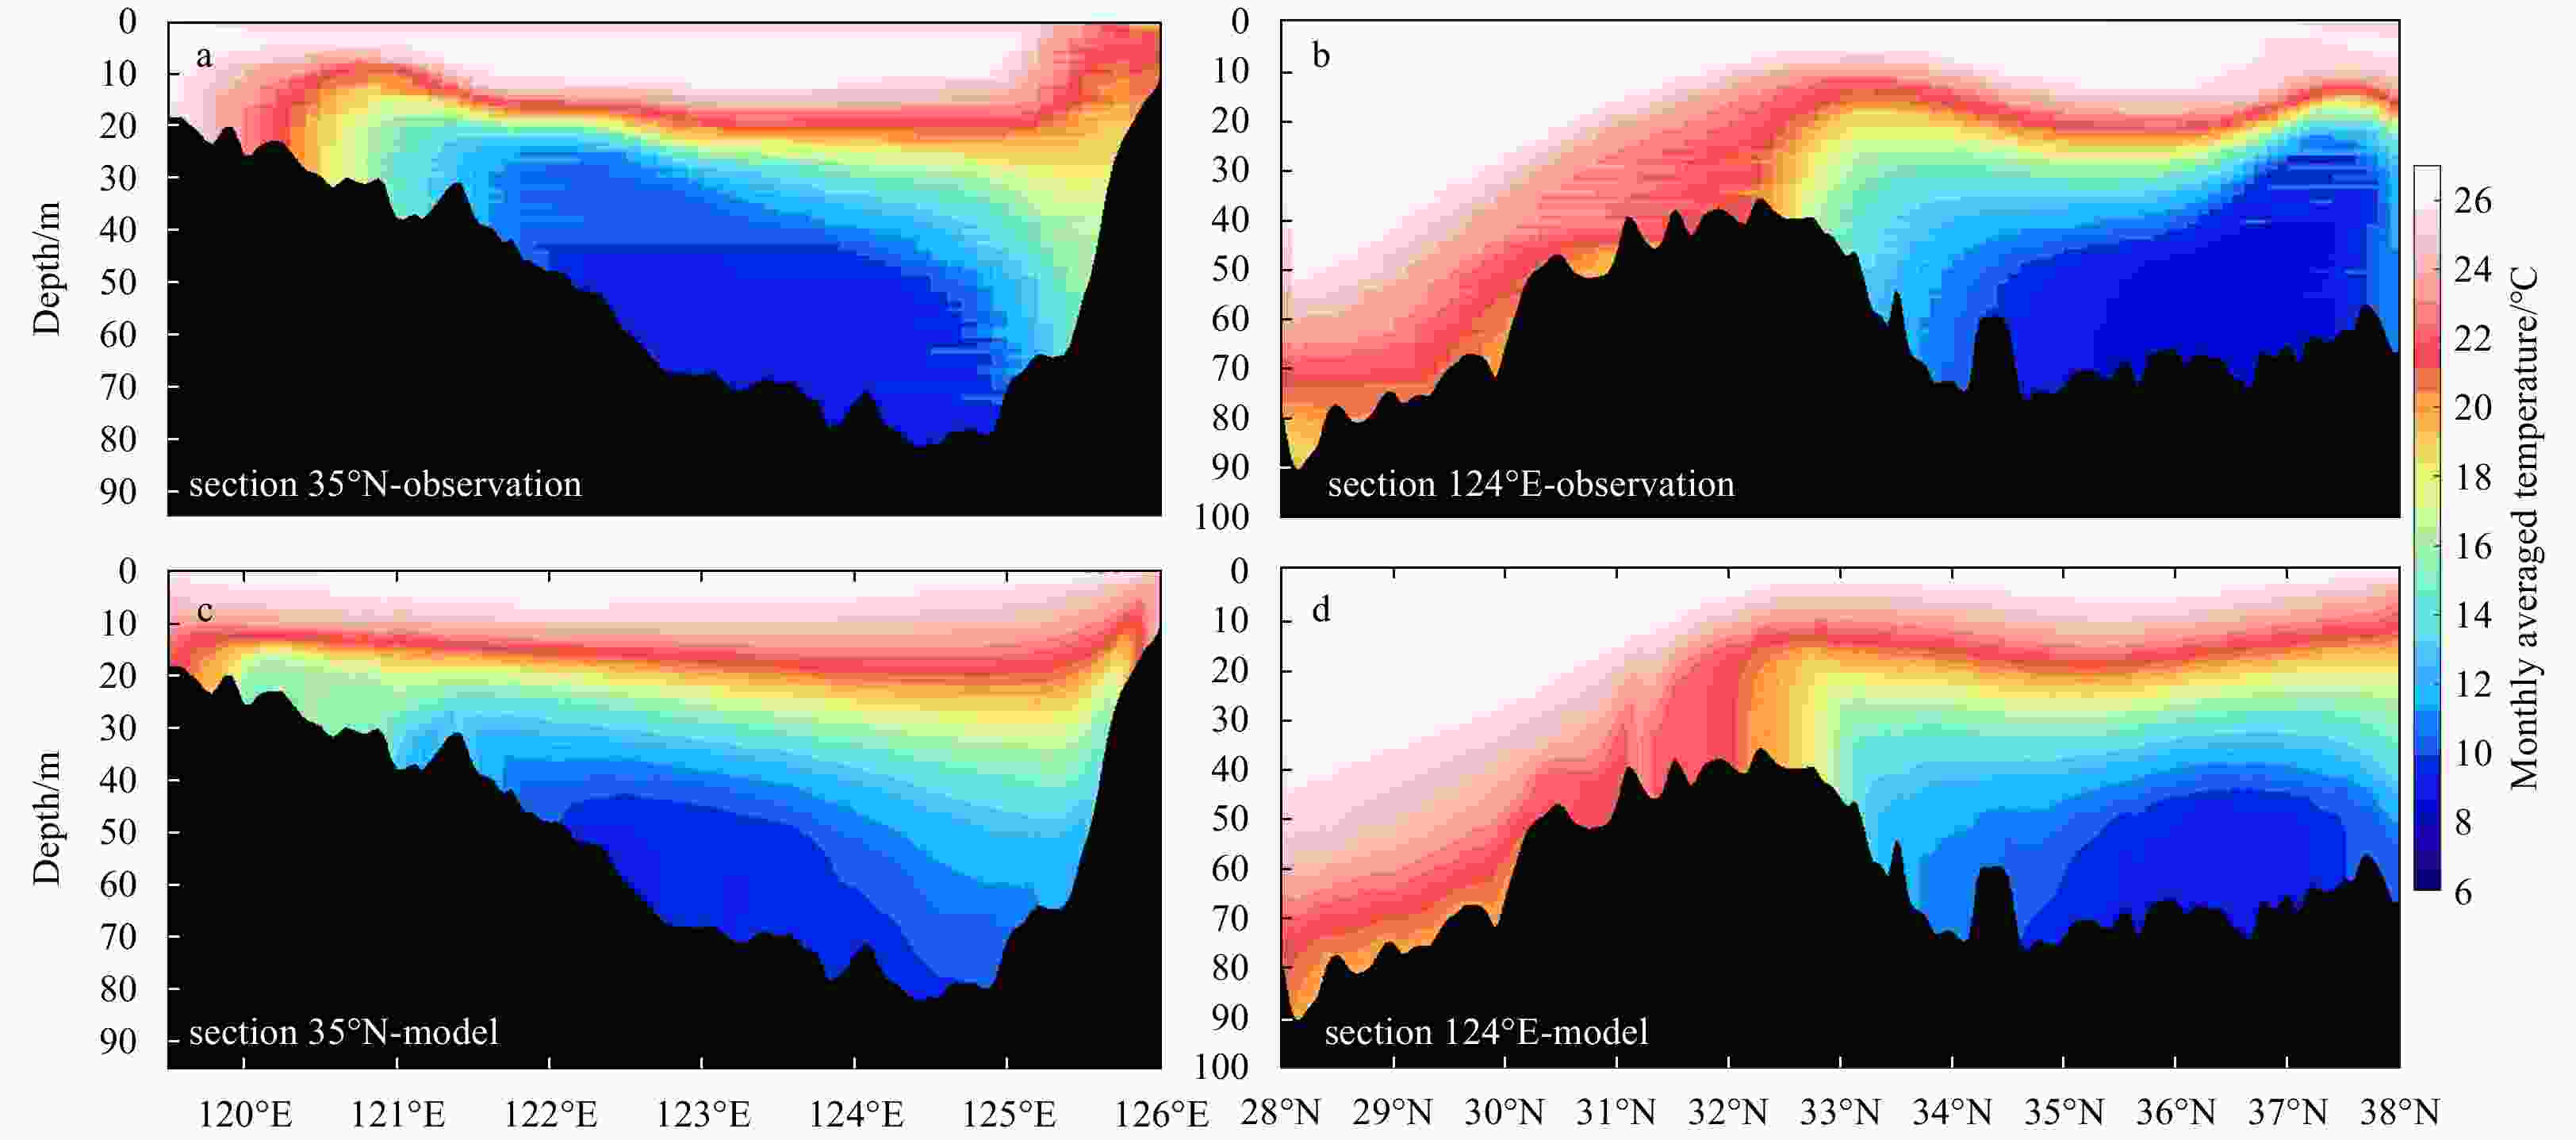
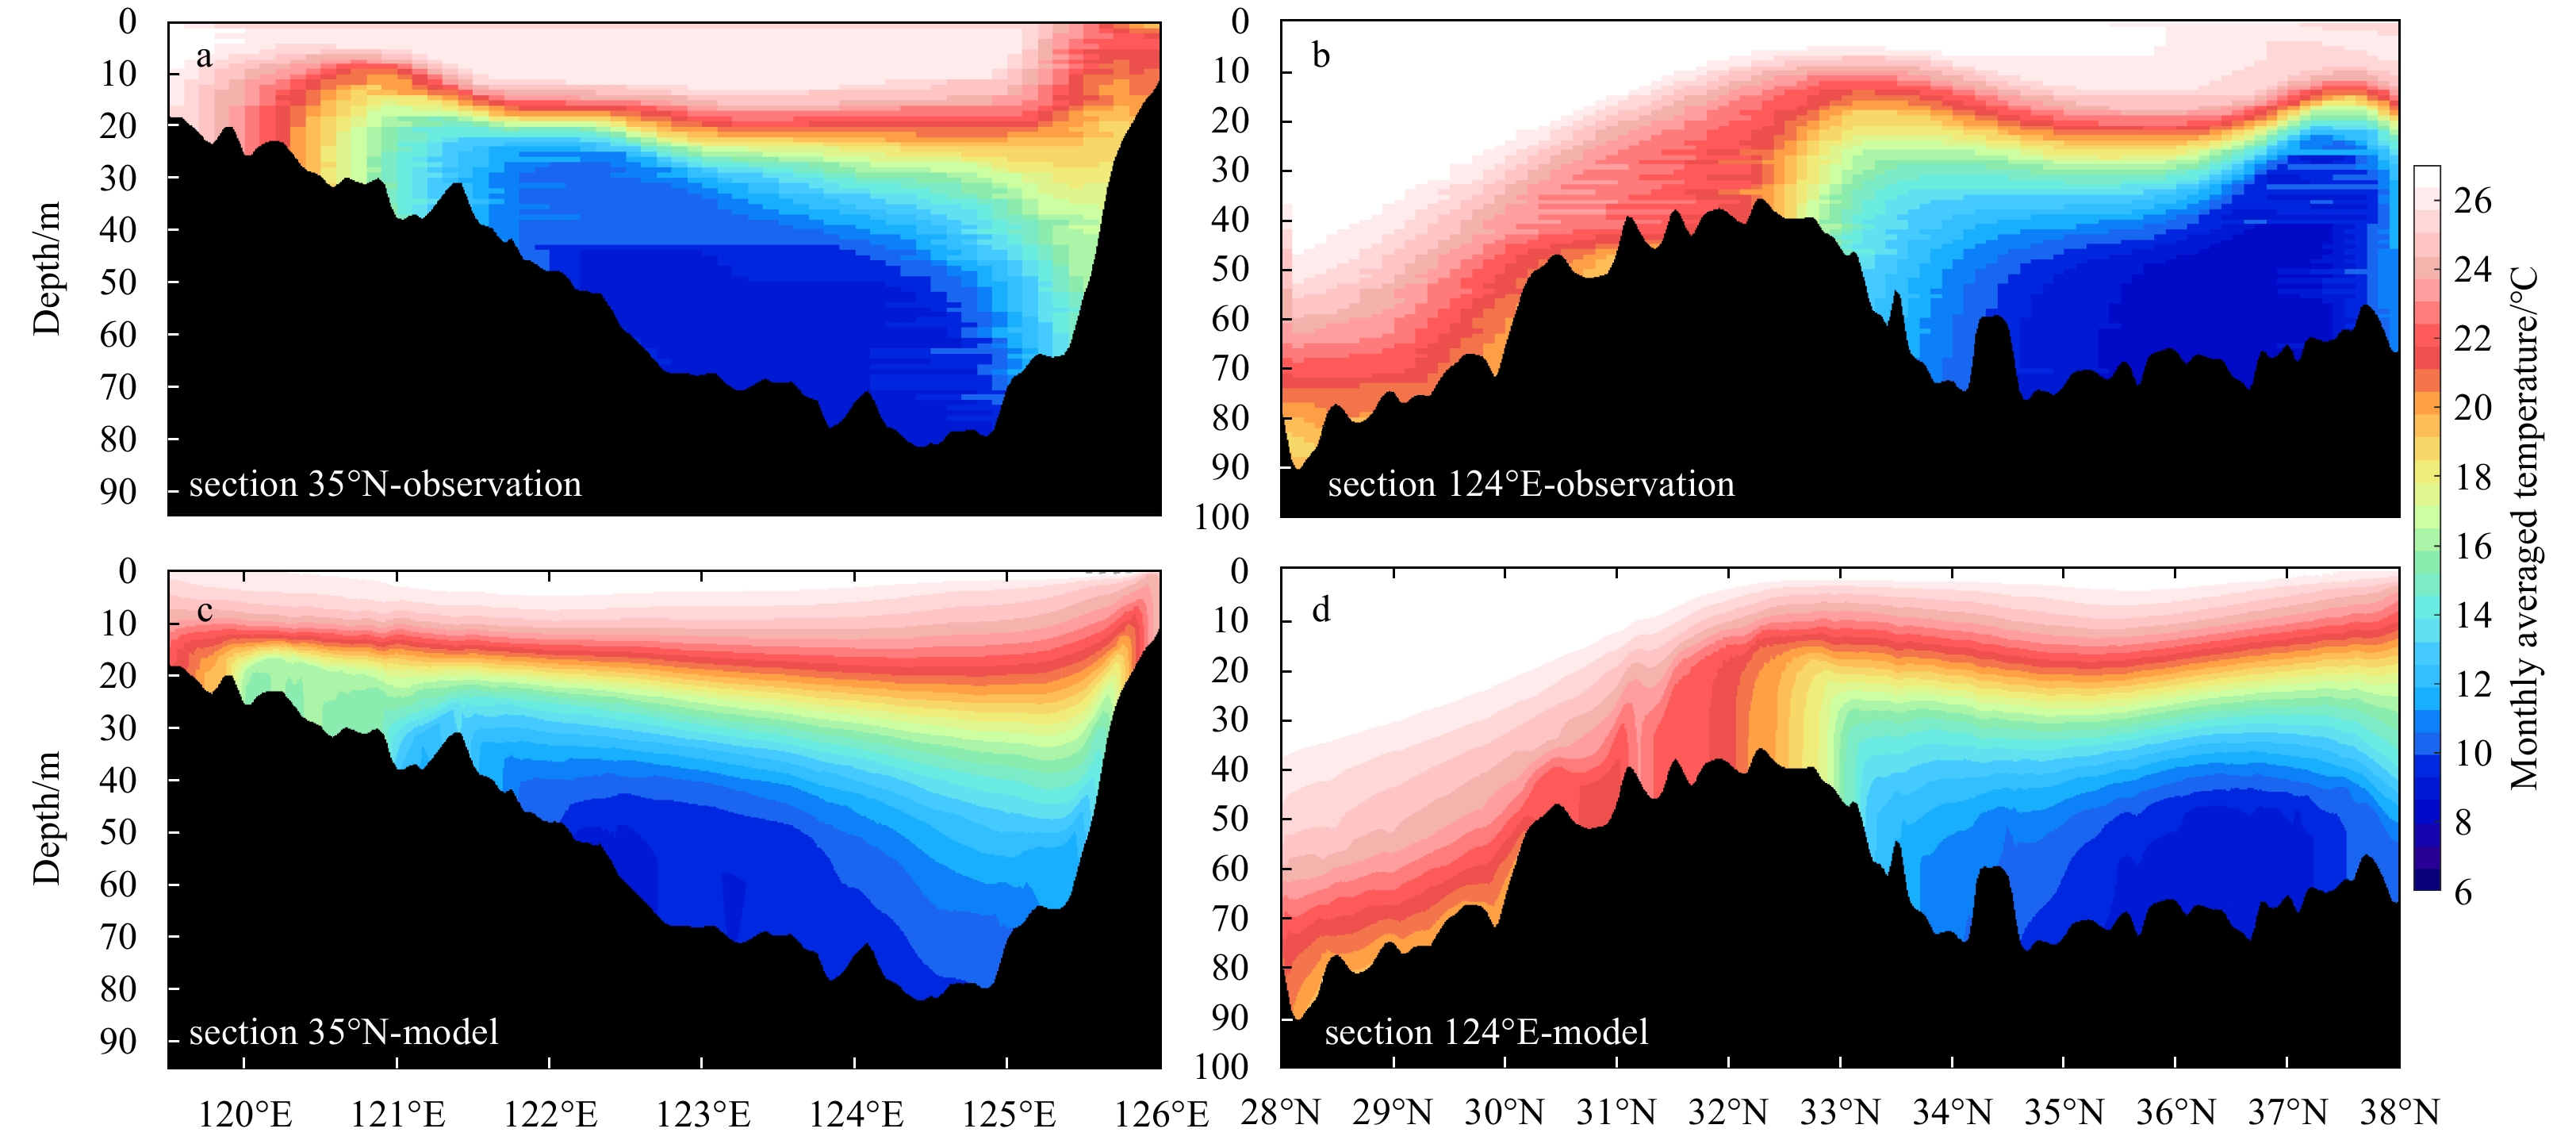
Figure 3. Vertical sections of monthly averaged temperature in August along 35°N (left column, a, c) and 124°E (right column, b, d), for observation from ocean atlas data (upper row, a, b) and model simulation (bottom row, c, d).
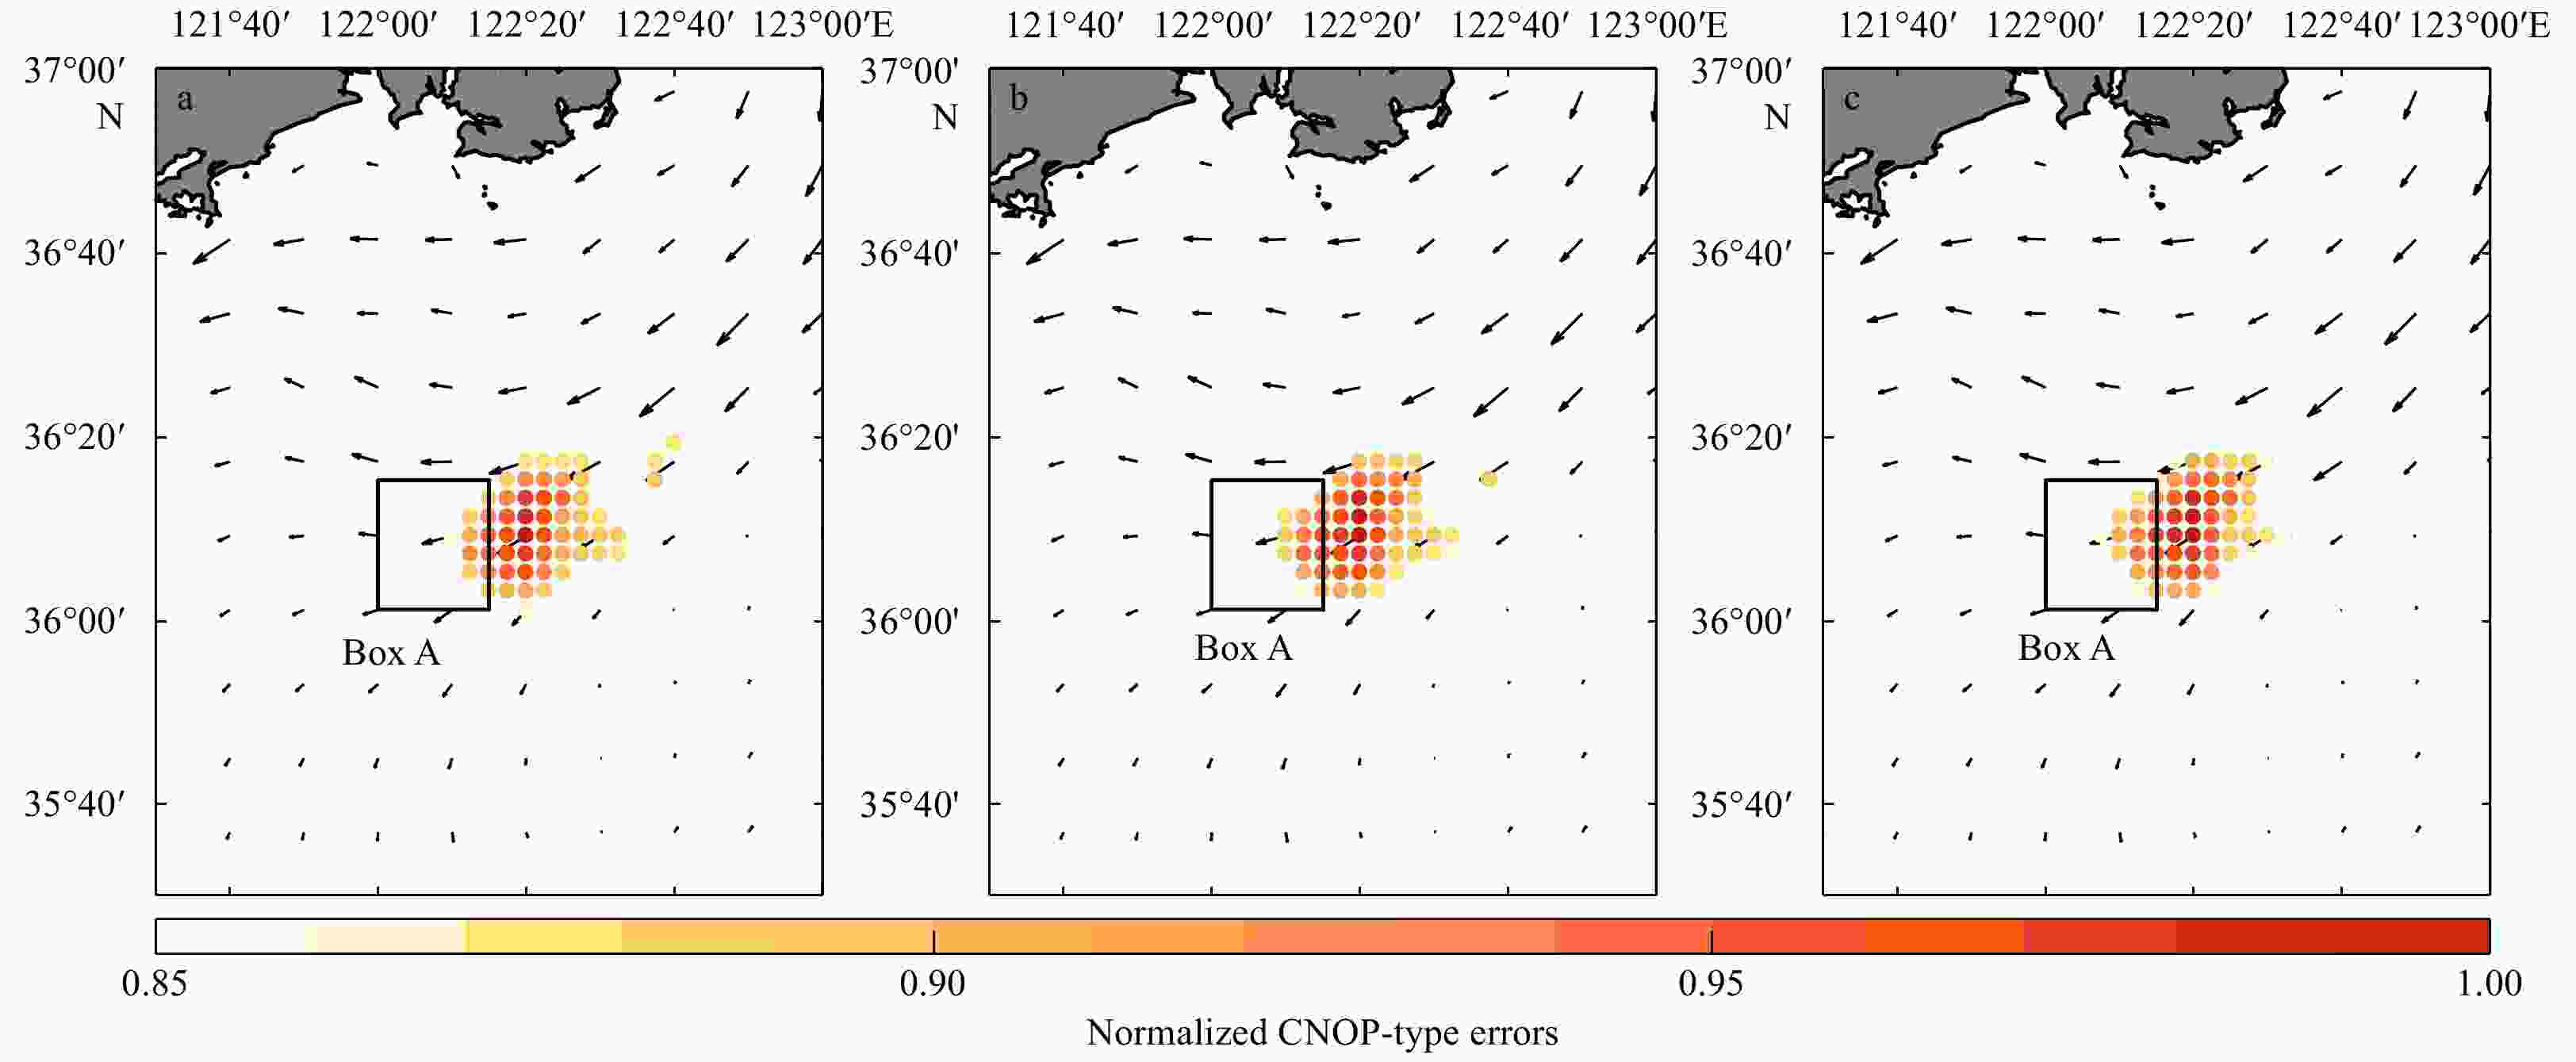
Figure 4. Locations (colored dots) of the identified sensitive areas and the climatological background currents (vectors) for cases of the 21st (a), 23rd (b) and 25th (c) climatology years, respectively. The sensitive areas are identified based on CNOP-type errors of vertically-integrated temperature after being normalized with their maximum values.

Figure 5. Temperature prediction errors (shaded) at water depth of 20 m over the verification area for experiments with adding initial random perturbations on four different areas at four different prediction times. Four different areas are the verification area (Exp_A_1, a1–4), sensitive area (Exp_A_2, b1–4), area to east of the verification area (Exp_A_3, c1–4), and area to northeast of the verification area (Exp_A_4, d1–4), respectively. Four different prediction times are the first, third, fifth and seventh prediction day, respectively.
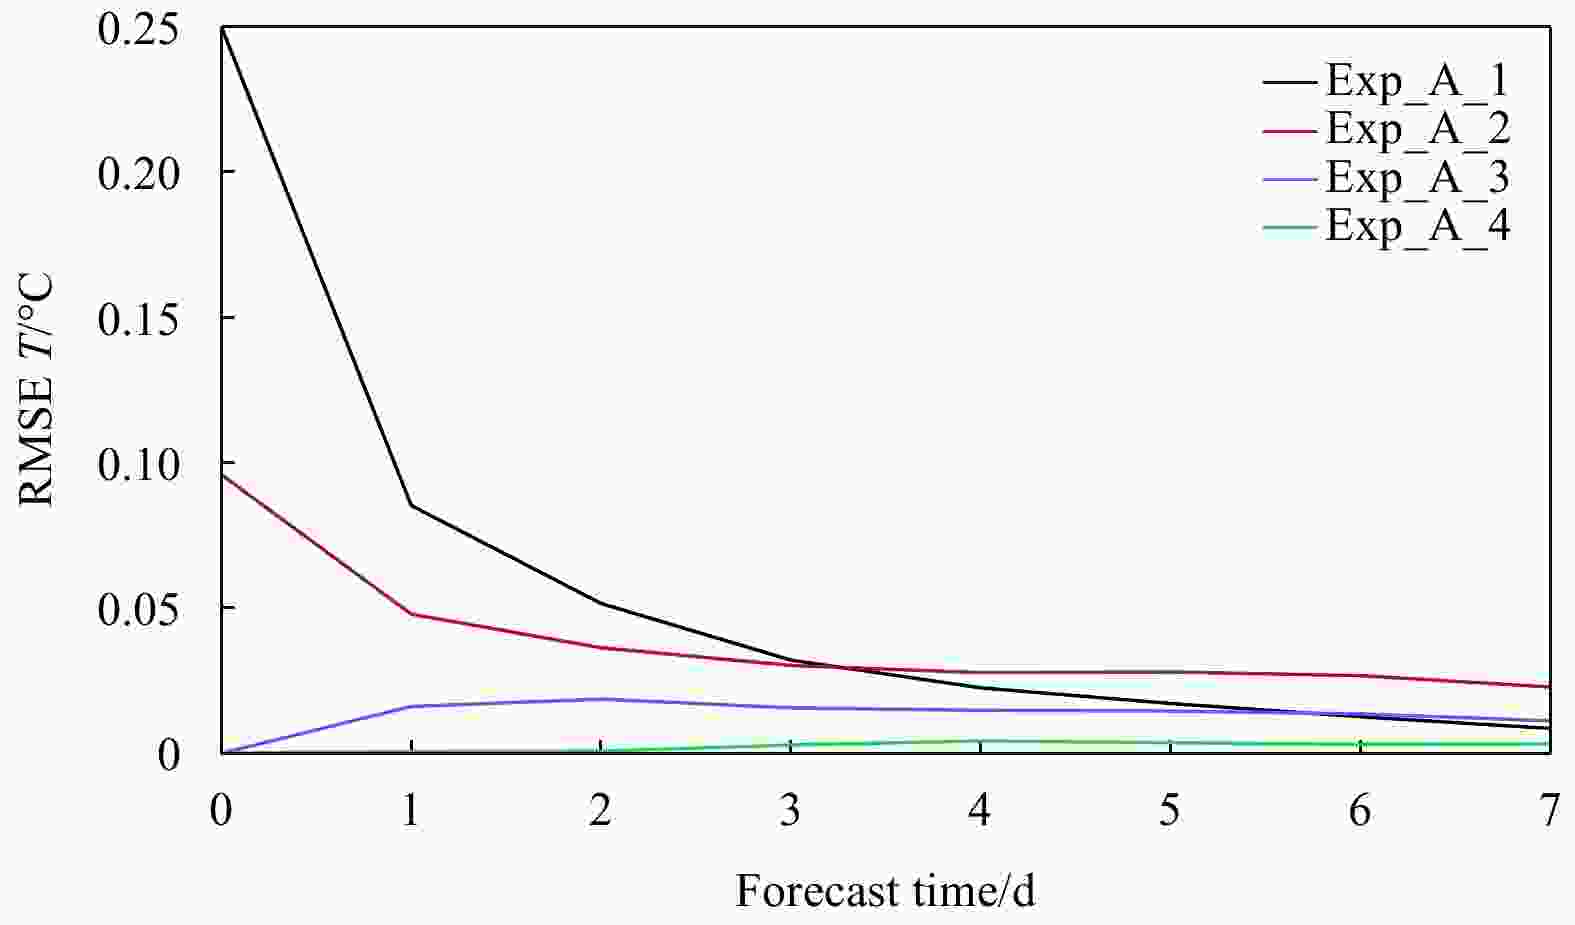
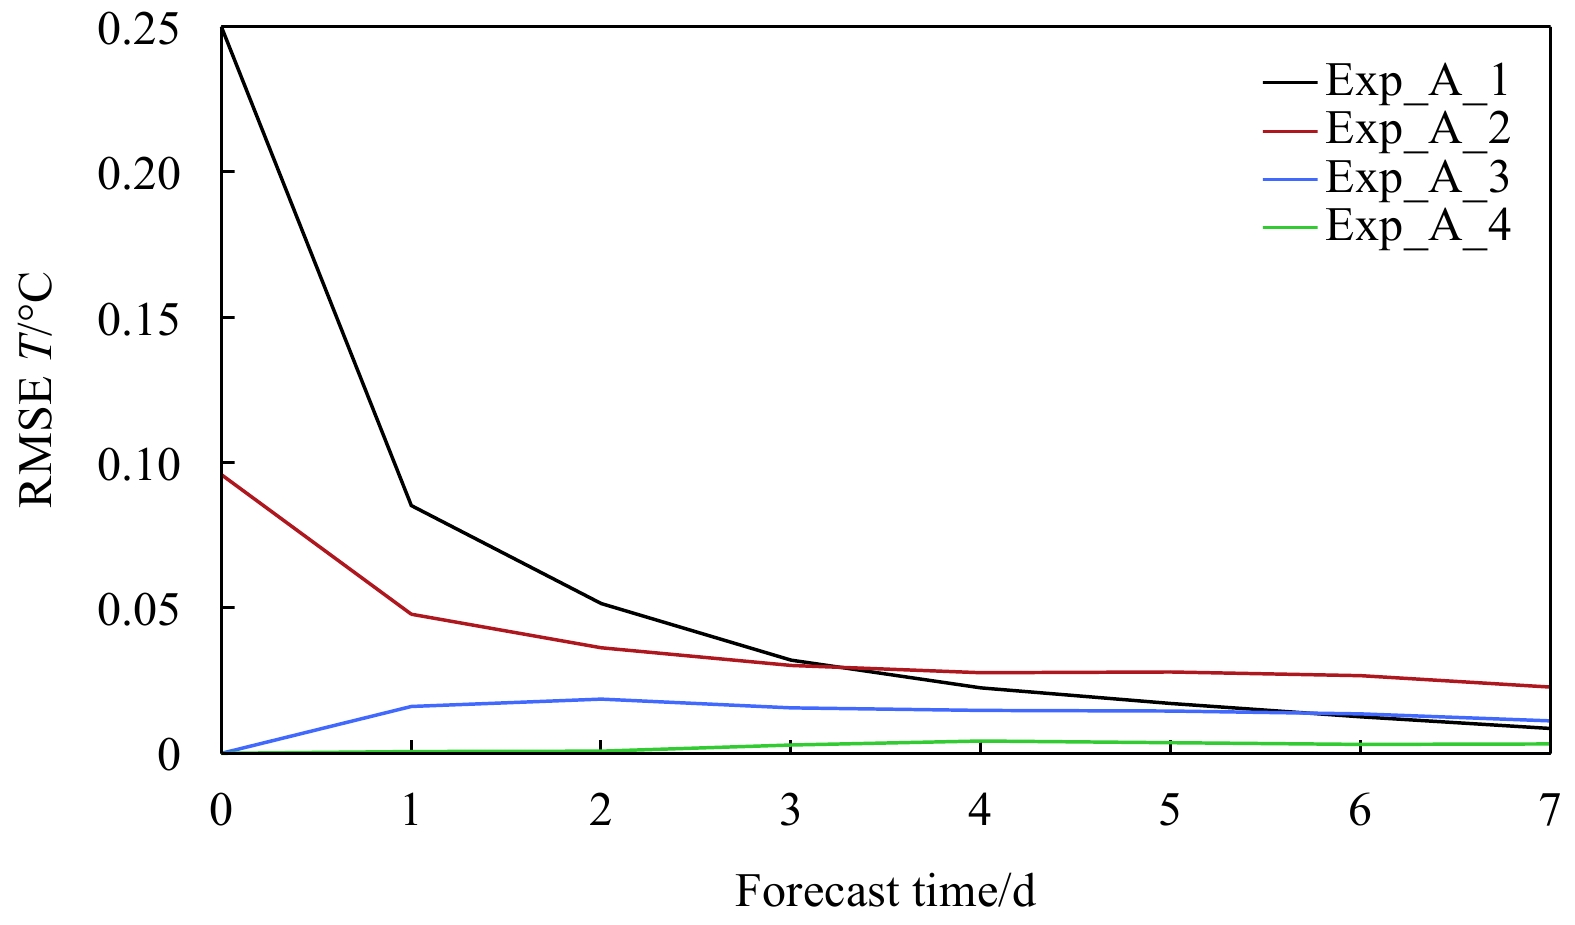
Figure 6. Temporal evolution of root mean square errors of area-averaged temperature profile over the verification area for experiments with adding initial random perturbations on the verification area (Exp_A_1, black line), sensitive area (Exp_A_2, red line), area to east of the verification area (Exp_A_3, blue line), area to northeast of the verification area (Exp_A_4, green line), respectively.

Figure 7. Temporal evolution of root mean square errors of area-averaged temperature profile over the verification area (a), and corresponding prediction benefits (b) for sensitivity experiments based on removing different initial random errors. Exp_R_1 and Exp_R_2 denote experiment with removing initial random errors from the verification area and sensitive area, respectively. Ctrl Run in a denotes experiment without removing initial errors from any areas.
Table 1. Three different cases for identifying sensitive areas
Case 1 Case 2 Case 3 Initial time August of the 21st year August of the 23rd year August of the 25th year  下载: 导出CSV
Table 2. Sensitivity experiments based on adding initial random perturbations
Experiment
nameInitial
conditionsLocation of adding
perturbationsTrue Run ICtrue no Exp_A_1 ICtrue verification area Exp_A_2 ICtrue sensitive area Exp_A_3 ICtrue east of the verification area Exp_A_4 ICtrue northeast of the verification area
下载: 导出CSV
Table 3. Sensitivity experiments based on removing initial random errors
Experiment
nameInitial
conditionsLocation of removing initial
random errors (replace ICpg with ICtrue)True Run ICtrue no Ctrl Run ICpg no Exp_R_1 ICpg verification area Exp_R_2 ICpg sensitive area
下载: 导出CSV
Table 4. Experimental design of balanced/imbalanced initial conditions (ICs)
Experiment name IC_mean IC_23 IC_25 IC_comb IC climatological mean of model
output from 6th to 25thmodel output of the
23rd climatic yearmodel output of the
25th climatic yearcombined ICs from
IC_23 and IC_251)Note: 1) The ICs are from model output of the 23rd climatic year at the model grid points (i, j) where (i+j) are odd and are from model output of the 25th climatic year at the model grid points (i, j) where (i+j) are even.
下载: 导出CSV
-
[1] Ancell B C, Mass C F. 2006. Structure, growth rates, and tangent linear accuracy of adjoint sensitivities with respect to horizontal and vertical resolution. Monthly Weather Review, 134(10): 2971–2988. doi: 10.1175/MWR3227.1 [2] Baehr J, McInerney D, Keller K, et al. 2008. Optimization of an observing system design for the North Atlantic meridional overturning circulation. Journal of Atmospheric and Oceanic Technology, 25(4): 625–634. doi: 10.1175/2007JTECHO535.1 [3] Bei Naifang, Zhang Fuqing, Nielsen-Gammon J W. 2012. Ensemble-based observation targeting for improving ozone prediction in Houston and the surrounding area. Pure and Applied Geophysics, 169(3): 539–554. doi: 10.1007/s00024-011-0386-z [4] Bishop C H, Etherton B J, Majumdar S J. 2001. Adaptive sampling with the ensemble transform Kalman filter: Part I. Theoretical aspects. Monthly Weather Review, 129(3): 420–436. doi: 10.1175/1520-0493(2001)129<0420:ASWTET>2.0.CO;2 [5] Chen Guozhen, Niu Yinyi, Wen Shengchang, et al. 1992. Marine Atlas of Bohai Sea, Yellow Sea, East China Sea (Hydrology) (in Chinese). Beijing: China Ocean Press [6] Chu P C, Wells S K, Haeger S D, et al. 1997. Temporal and spatial scales of the Yellow Sea thermal variability. Journal of Geophysical Research: Oceans, 102(C3): 5655–5667. doi: 10.1029/96JC03428 [7] Duan Wansuo, Li Xuquan, Tian Ben. 2018. Towards optimal observational array for dealing with challenges of El Niño-Southern Oscillation predictions due to diversities of El Niño. Climate Dynamics, 51(9): 3351–3368. doi: 10.1007/s00382-018-4082-x [8] Duan Wansuo, Mu Mu, Wang Bin. 2004. Conditional nonlinear optimal perturbations as the optimal precursors for El Nino-Southern Oscillation events. Journal of Geophysical Research: Atmospheres, 109(D23): D23105 [9] Hamill T M, Snyder C. 2002. Using improved background-error covariances from an ensemble Kalman filter for adaptive observations. Monthly Weather Review, 130(6): 1552–1572. doi: 10.1175/1520-0493(2002)130<1552:UIBECF>2.0.CO;2 [10] Hu Junya, Duan Wansuo. 2016. Relationship between optimal precursory disturbances and optimally growing initial errors associated with ENSO events: Implications to target observations for ENSO prediction. Journal of Geophysical Research: Oceans, 121(5): 2901–2917. doi: 10.1002/2015JC011386 [11] Hu Huiqin, Sun Juanzhen, Zhang Qinghong. 2017a. Assessing the impact of surface and wind profiler data on fog forecasting using WRF 3DVAR: An OSSE study on a dense fog event over North China. Journal of Applied Meteorology and Climatology, 56(4): 1059–1081. doi: 10.1175/JAMC-D-16-0246.1 [12] Hu Huiqin, Zhang Qinghong, Sun Juanzhen, et al. 2017b. Impact of high-frequency observations on fog forecasting: A case study of OSSE. Tellus A: Dynamic Meteorology and Oceanography, 69(1): 1396182. doi: 10.1080/16000870.2017.1396182 [13] Hu Huiqin, Zhang Qinghong, Xie Baoguo, et al. 2014. Predictability of an advection fog event over North China. Part I: Sensitivity to initial condition differences. Monthly Weather Review, 142(5): 1803–1822. doi: 10.1175/MWR-D-13-00004.1 [14] Huang Ling, Meng Zhiyong. 2014. Quality of the target area for metrics with different nonlinearities in a mesoscale convective system. Monthly Weather Review, 142(7): 2379–2397. doi: 10.1175/MWR-D-13-00244.1 [15] Jin Meibing, Wang Zongshan, Xu Bochang. 1993. Three-dimensional numerical prediction of vertical temperature structure of the Huanghai and the Bohai Seas. Acta Oceanologica Sinica, 12(4): 511–520 [16] Kramer W, Dijkstra H A, Pierini S, et al. 2012. Measuring the impact of observations on the predictability of the Kuroshio extension in a shallow-water model. Journal of Physical Oceanography, 42(1): 3–17. doi: 10.1175/JPO-D-11-014.1 [17] Langland R H. 2005. Issues in targeted observing. Quarterly Journal of the Royal Meteorological Society, 131(613): 3409–3425. doi: 10.1256/qj.05.130 [18] Large W G, McWilliams J C, Doney S C. 1994. Oceanic vertical mixing: a review and a model with a nonlocal boundary layer parameterization. Reviews of Geophysics, 32(4): 363–403. doi: 10.1029/94RG01872 [19] Li Yineng, Peng Shiqiu, Liu Duanling. 2014. Adaptive observation in the South China Sea using CNOP approach based on a 3-D ocean circulation model and its adjoint model. Journal of Geophysical Research: Oceans, 119(12): 8973–8986. doi: 10.1002/2014JC010220 [20] Liang Peng, Mu Mu, Wang Qiang, et al. 2019. Optimal precursors triggering the Kuroshio intrusion into the South China Sea obtained by the conditional nonlinear optimal perturbation approach. Journal of Geophysical Research: Oceans, 124(6): 3941–3962. doi: 10.1029/2018JC014545 [21] MacKinnon J A, Gregg M C. 2003. Mixing on the late-summer New England shelf-solibores, shear, and stratification. Journal of Physical Oceanography, 33(7): 1476–1492. doi: 10.1175/1520-0485(2003)033<1476:MOTLNE>2.0.CO;2 [22] MacKinnon J A, Gregg M C. 2005. Spring mixing: turbulence and internal waves during restratification on the New England shelf. Journal of Physical Oceanography, 35(12): 2425–2443. doi: 10.1175/JPO2821.1 [23] Majumdar S J. 2016. A review of targeted observations. Bulletin of the American Meteorological Society, 97(12): 2287–2303. doi: 10.1175/BAMS-D-14-00259.1 [24] Morss R E, Emanuel K A, Snyder C. 2001. Idealized adaptive observation strategies for improving numerical weather prediction. Journal of the Atmospheric Sciences, 58(2): 210–232. doi: 10.1175/1520-0469(2001)058<0210:IAOSFI>2.0.CO;2 [25] Mu Mu. 2013. Methods, current status, and prospect of targeted observation. Science China Earth Sciences, 56(12): 1997–2005. doi: 10.1007/s11430-013-4727-x [26] Mu Mu, Duan Wansuo, Chen Dake, et al. 2015. Target observations for improving initialization of high-impact ocean-atmospheric environmental events forecasting. National Science Review, 2(2): 226–236. doi: 10.1093/nsr/nwv021 [27] Mu Mu, Duan Wansuo, Tang Youmin. 2017. The predictability of atmospheric and oceanic motions: retrospect and prospects. Science China Earth Sciences, 60(11): 2001–2012. doi: 10.1007/s11430-016-9101-x [28] Mu Mu, Duan Wansuo, Wang Bin. 2003. Conditional nonlinear optimal perturbation and its applications. Nonlinear Processes in Geophysics, 10(6): 493–501. doi: 10.5194/npg-10-493-2003 [29] Palmer T N, Gelaro R, Barkmeijer J, et al. 1998. Singular vectors, metrics, and adaptive observations. Journal of the Atmospheric Sciences, 55(4): 633–653. doi: 10.1175/1520-0469(1998)055<0633:SVMAAO>2.0.CO;2 [30] Powell M J D. 1983. VMCWD: A Fortran subroutine for constrained optimization. ACM SIGMAP Bulletin, 32: 4–16 [31] Qin Xiaohao, Mu Mu. 2011. A study on the reduction of forecast error variance by three adaptive observation approaches for tropical cyclone prediction. Monthly Weather Review, 139(7): 2218–2232. doi: 10.1175/2010MWR3327.1 [32] Qiu Daoli. 1982. Characteristic analysis on the daily variation of sea water temperature in the Bohai sea and inshore region of the Huanghai sea and east China Sea. Acta Oceanologica Sinica (in Chinese), 4(4): 391–403 [33] Shchepetkin A F, McWilliams J C. 2005. The regional oceanic modeling system (ROMS): A split-explicit, free-surface, topography-following-coordinate oceanic model. Ocean Modelling, 9(4): 347–404. doi: 10.1016/j.ocemod.2004.08.002 [34] Tan Xiaowei, Wang Dongliang. 2010. Preliminary study of sensitive areas for several tropical cyclone track prediction cases in 2007. Atmospheric and Oceanic Science Letters, 3(6): 299–302. doi: 10.1080/16742834.2010.11446887 [35] Tan Xiaowei, Wang Bin, Wang Dongliang. 2010. Impact of different guidances on sensitive areas of targeting observations based on the CNOP method. Acta Meteorologica Sinica, 24(1): 17–30 [36] Wajsowicz R C. 1993. A consistent formulation of the anisotropic stress tensor for use in models of the large-scale ocean circulation. Journal of Computational Physics, 105(2): 333–338. doi: 10.1006/jcph.1993.1079 [37] Wang Qiang, Mu Mu, Dijkstra H A. 2013. The similarity between optimal precursor and optimally growing initial error in prediction of Kuroshio large meander and its application to targeted observation. Journal of Geophysical Research: Oceans, 118(2): 869–884. doi: 10.1002/jgrc.20084 [38] Wang Bin, Tan Xiaowei. 2009. A fast algorithm for solving CNOP and associated target observation tests. Acta Meteorologica Sinica, 23(4): 387–402 [39] Wen Xixi, Duan Wansuo. 2019. Errors in current velocity in the low-latitude North Pacific: results from the regional ocean modeling system. Advances in Atmospheric Sciences, 36(4): 397–416. doi: 10.1007/s00376-018-8140-4 [40] Wu C C, Chen J H, Lin P H, et al. 2007. Targeted observations of tropical cyclone movement based on the adjoint-derived sensitivity steering vector. Journal of the Atmospheric Sciences, 64(7): 2611–2626. doi: 10.1175/JAS3974.1 [41] Xia Changshui, Qiao Fangli, Yang Yongzeng, et al. 2006. Three-dimensional structure of the summertime circulation in the Yellow Sea from a wave-tide-circulation coupled model. Journal of Geophysical Research: Oceans, 111(C11): C11S03. doi: 10.1029/2005JC003218 [42] Yang Dezhou, Yin Baoshu, Liu Zhiliang, et al. 2011. Numerical study of the ocean circulation on the East China Sea shelf and a Kuroshio bottom branch northeast of Taiwan in summer. Journal of Geophysical Research: Oceans, 116(C5): C05015 [43] Zhang Mengning, Liu Jinfang, Mao Kexiu, et al. 2006. The general distribution characteristics of thermocline of China Sea. Marine Forecasts (in Chinese), 23(4): 51–58 [44] Zhang Kun, Mu Mu, Wang Qiang. 2017. Identifying the sensitive area in adaptive observation for predicting the upstream Kuroshio transport variation in a 3-D ocean model. Science China Earth Sciences, 60(5): 866–875. doi: 10.1007/s11430-016-9020-8 [45] Zhang Kun, Mu Mu, Wang Qiang, et al. 2019. CNOP-based adaptive observation network designed for improving upstream Kuroshio transport prediction. Journal of Geophysical Research: Oceans, 124(6): 4350–4364. doi: 10.1029/2018JC014490 [46] Zhang Kun, Wang Qiang, Mu Mu, et al. 2016. Effects of optimal initial errors on predicting the seasonal reduction of the upstream Kuroshio transport. Deep Sea Research Part I: Oceanographic Research Papers, 116: 220–235. doi: 10.1016/j.dsr.2016.08.008 [47] Zhou Feifan, Zhang He. 2014. Study of the schemes based on CNOP method to identify sensitive areas for typhoon targeted observations. Chinese Journal of Atmospheric Sciences (in Chinese), 38(2): 261–272 -


 点击查看大图

计量
- 文章访问数: 294
- HTML全文浏览量: 116
- PDF下载量: 13
- 被引次数: 0

